The Bull’s-eye Chart
The Bull’s-eye Chart plots the cut-offs (status periods) in a CPI - SPI matrix. There are four quadrants to this chart:
- Behind Schedule Over Budget
- Behind Schedule Under Budget
- Ahead of Schedule Under Budget
- Ahead of Schedule Over Budget.
The Bull’s-eye chart lets you quickly determine if your project is ahead/behind schedule and over/under budget and monitor its trending.
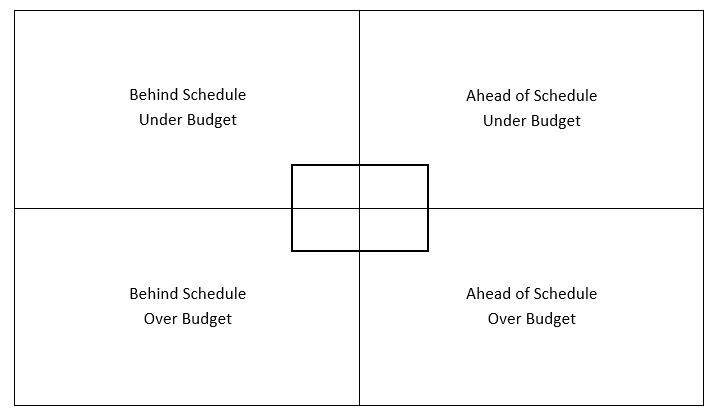
The above illustration shows the four quadrant areas that form the Bull’s-eye Chart. The upper right quadrant is considered the most favorable.
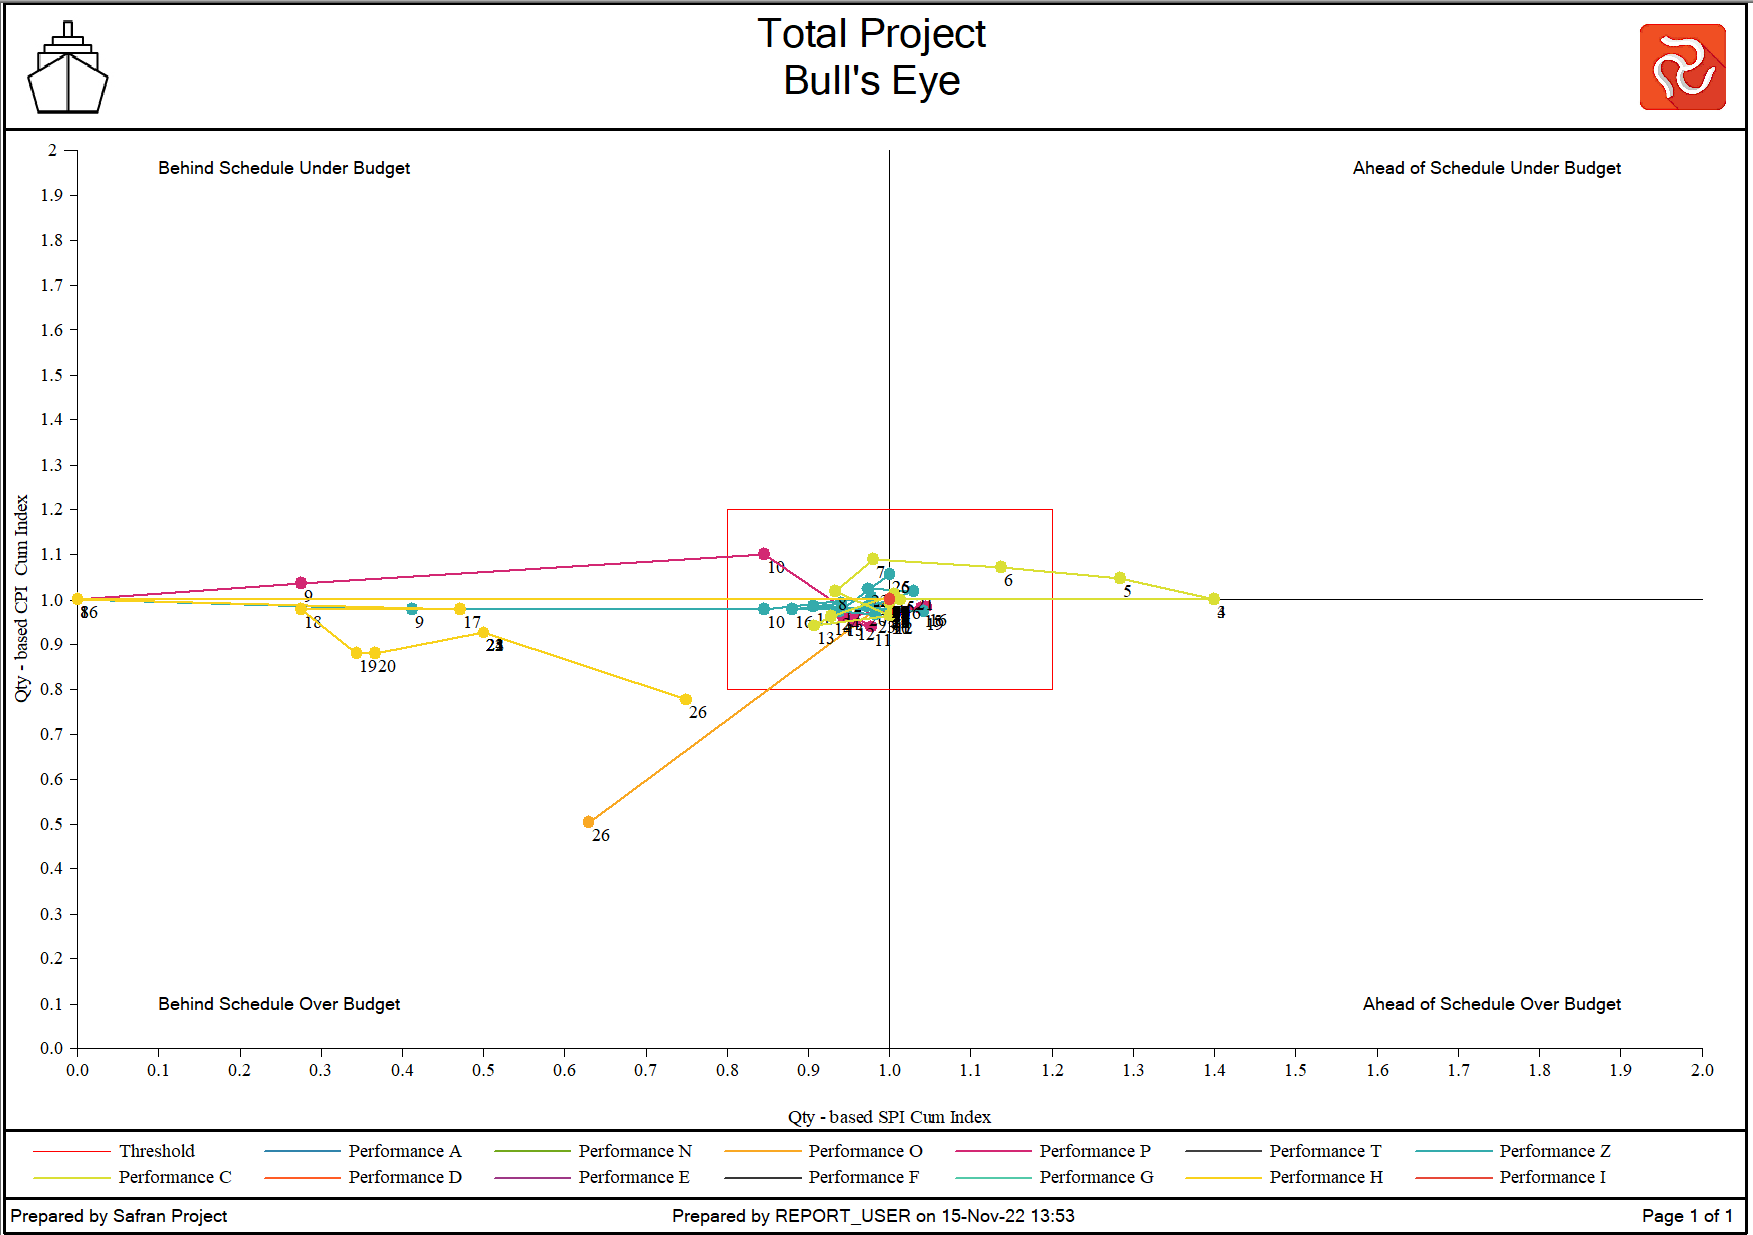
The bull’s-eye report can also be drawn using the performance factor (the inverse of the CPI and SPI values). If so, the lower left corner becomes the most favorable.
Below is an example from Safran Project:
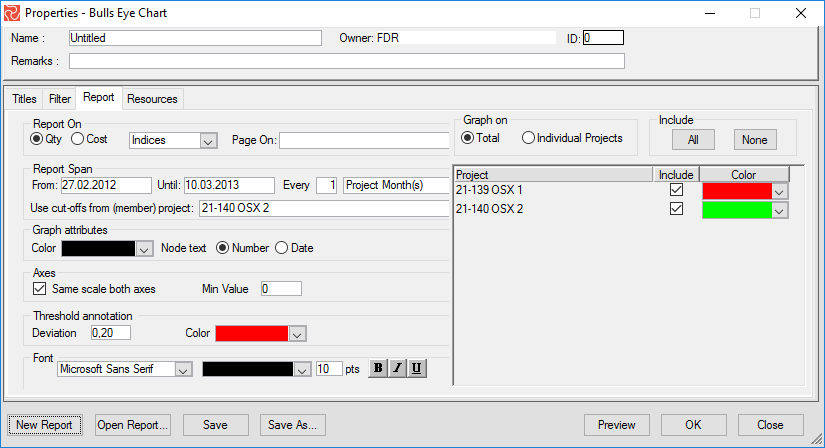
Configuring the Bull’s-eye Chart
The Bull’s-eye Chart configuration pane contains four tabs. The Titles tab sets report headings and footers, the Filters tab selects activities or groups of activities to include in your report, the Report tab allows you to configure and fine-tune your report, and the Resource tab produces specific reports focusing on all or only a selected set of your resources.
The Report pane lets you specify how your report should be organized. You can also use this pane to select report span, report periods to be used, graph attributes, define the threshold band, and create multiple pages grouped by common code values, like, for example, discipline, project phase OBS, WBS, etc. Using the Report pane, you can also select Cost or QTY as the basis for the report.
- Select cost or QTY as the basis for report calculations.
- Specify report span and interval—the number of days/weeks/bi-weeks/calendar months, project months, quarters, or years—each mark on the axis graph should represent.
- Specify the formatting of the graph attribute (color to be used) and select to show the period number or cut-off dates to be displayed.
- Set the Bull’s-eye threshold or deviation band in decimals, and select a color for the threshold band.
- Specify color, font, and font attributes for the quadrant sub-titles.
- Press Print Preview to view the report, direct the output to a printer, or save the report to a file.
- To focus and zoom in on the center of the Bull’s-eye report, you can specify minimum values on the axes. This can be useful when the project performance centers on the report axis's center.
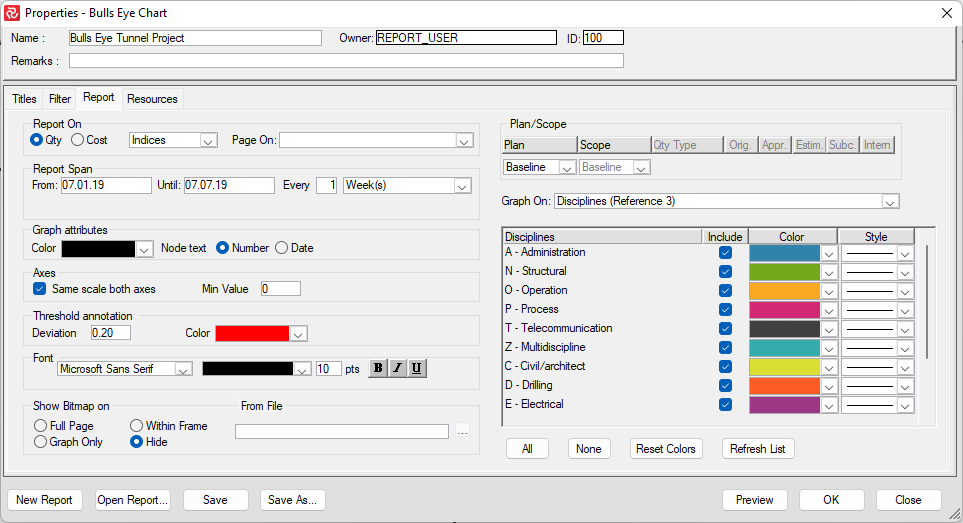
Bull’s-eye Report for Project Groups - Portfolio and Programs
The Bull’s-eye report can also be produced for project groups. You can then select to show a single trend line representing the aggregated performance of the portfolio, program, or multi-project group, or you can have individual lines per project to compare the performance of each project within the group.
All projects within the group are recommended to follow an identical pattern of status updates. The report can use QTY or cost data and show indexes or performance data. Cutoff dates are selected from one of the member projects.
To the right of the report configuration window, you can configure the individual lines or select to show a summarized line for the entire portfolio.