The View Tab
In addition to the Barchart, you can add different sub-windows or views to the screen. These views can also be un-docked and put on a second screen connected to your PC. Five information views can be shown together with the Barchart. Select the open in new window option from the shortcut menu to un-dock any of these.
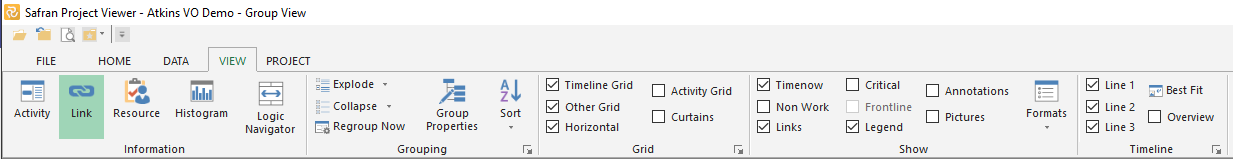
The View Tab.
The View tab is organised into five sections.
- Information
- Grouping
- Grid
- Show
- Timeline
Activity Information – adds a tab-separated window with different activity information. The Activity information pane is a tab-separated window to browse detailed information about the selected/highlighted activity.
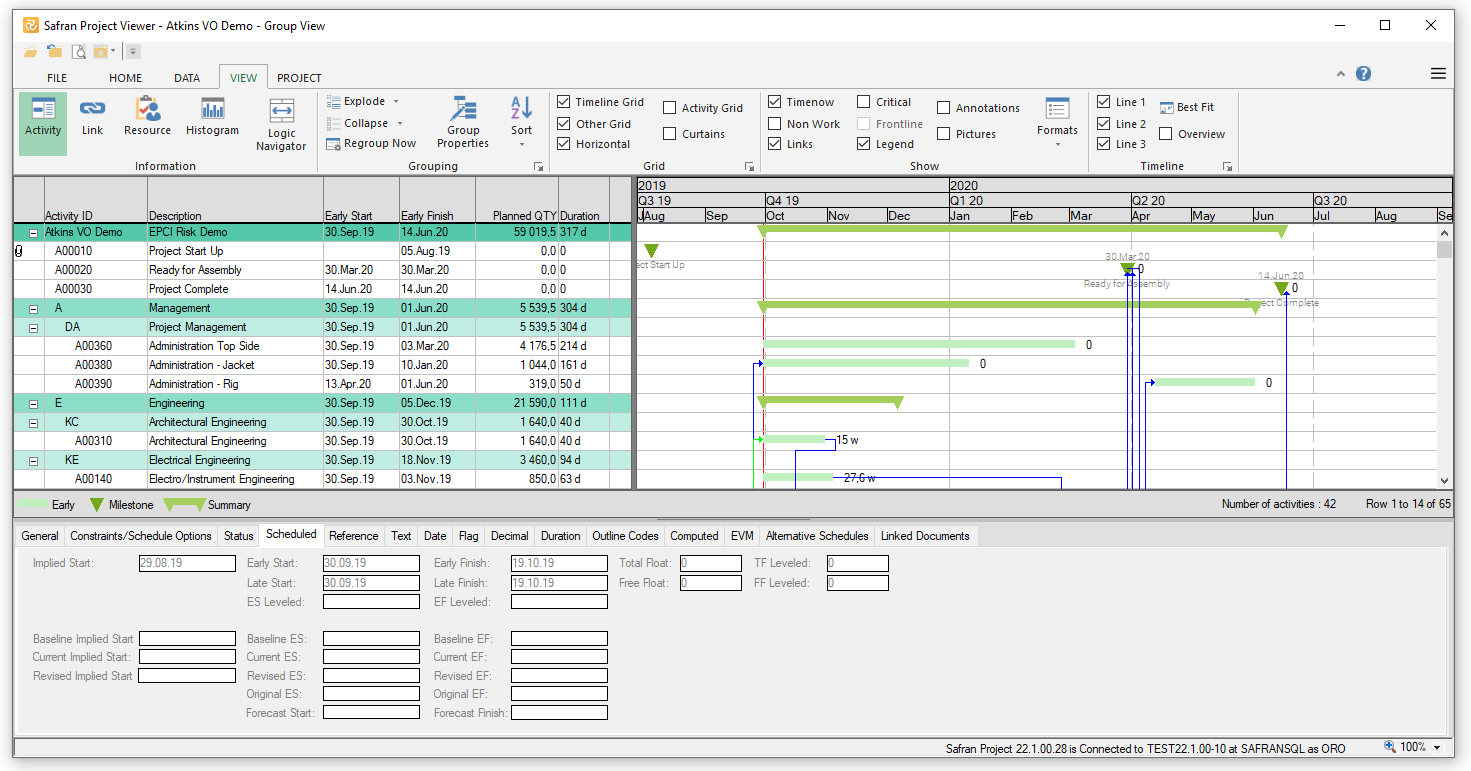
The Barchart Editor with the Activity Information is shown at the bottom.
Link Information – displays the logic with predecessors and successors of the selected activity. Clicking on a predecessor or successor in the links window lets you browse the schedule logically and takes you to this activity. You can also select data to be displayed by selecting the columns list from the short-cut menu.
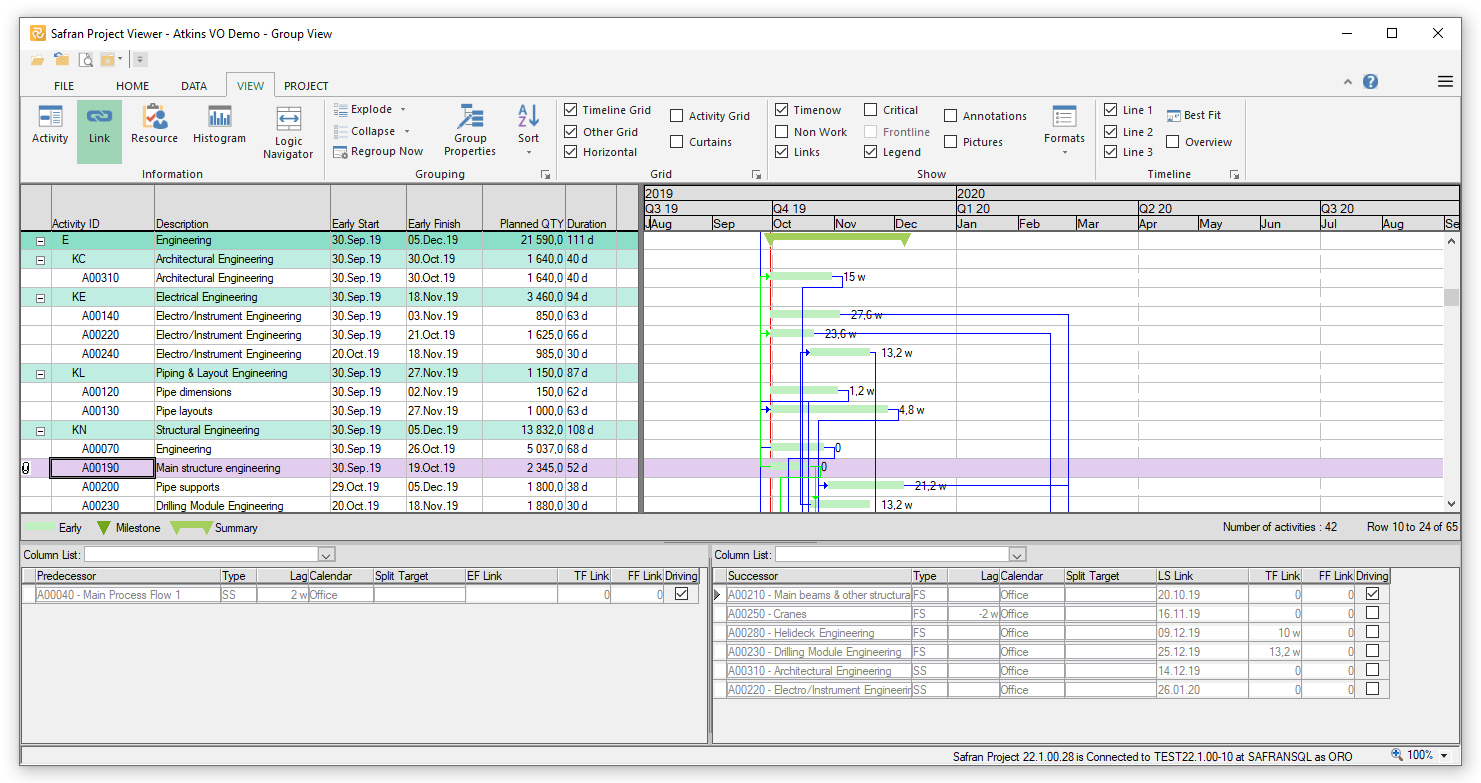
The Barchart Editor with the Link Information is shown at the bottom.
Resource Information – displays the resource(s) added to an activity and a resource load histogram. The resource histogram can be modified using the Histogram properties option (see short-cut menu in the graphical area)
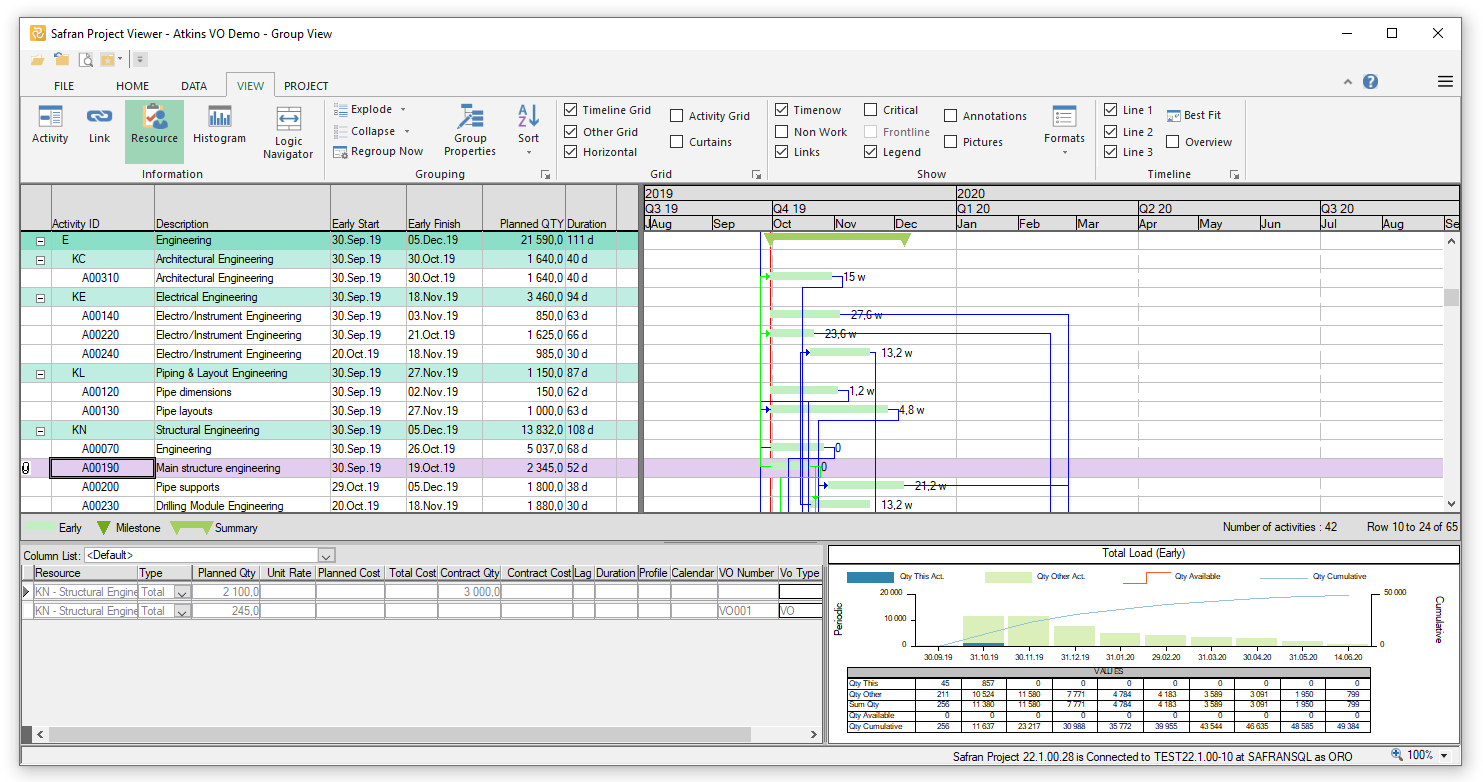
The Barchart Editor with the Resources Information is shown at the bottom.
As the Viewer user, you can change the properties of the resource histogram.
You can change the span, set start and finish dates, specify the interval, and select to show early dates, late dates, or resource-leveled dates. The histogram can report quantity (hrs/scope of work) or cost.
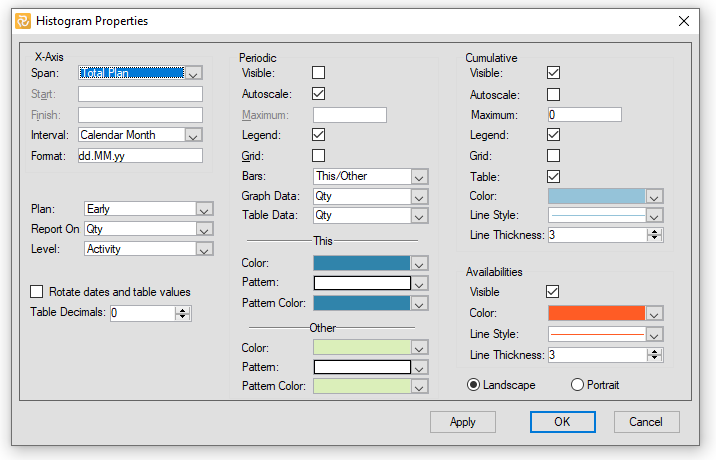
The Resource Histogram properties window.
The Bars option has two options in its drop-down (see centre section). The default setting is This/Other. The activity you select in the Barchart will appear in blue, and the workload (or cost) for all other activities will appear in green. This allows you to track the activities in the resource histogram as you move up and down the activity list in the Barchart/activity Columns.
If you double-click a resource bar in the resource histogram, a new window provides you with a list of the activities that build the load for the bar/the period the bar represents. You can jump to one of the activities from this list by double-clicking its line or highlighting it and pressing the go-to button.
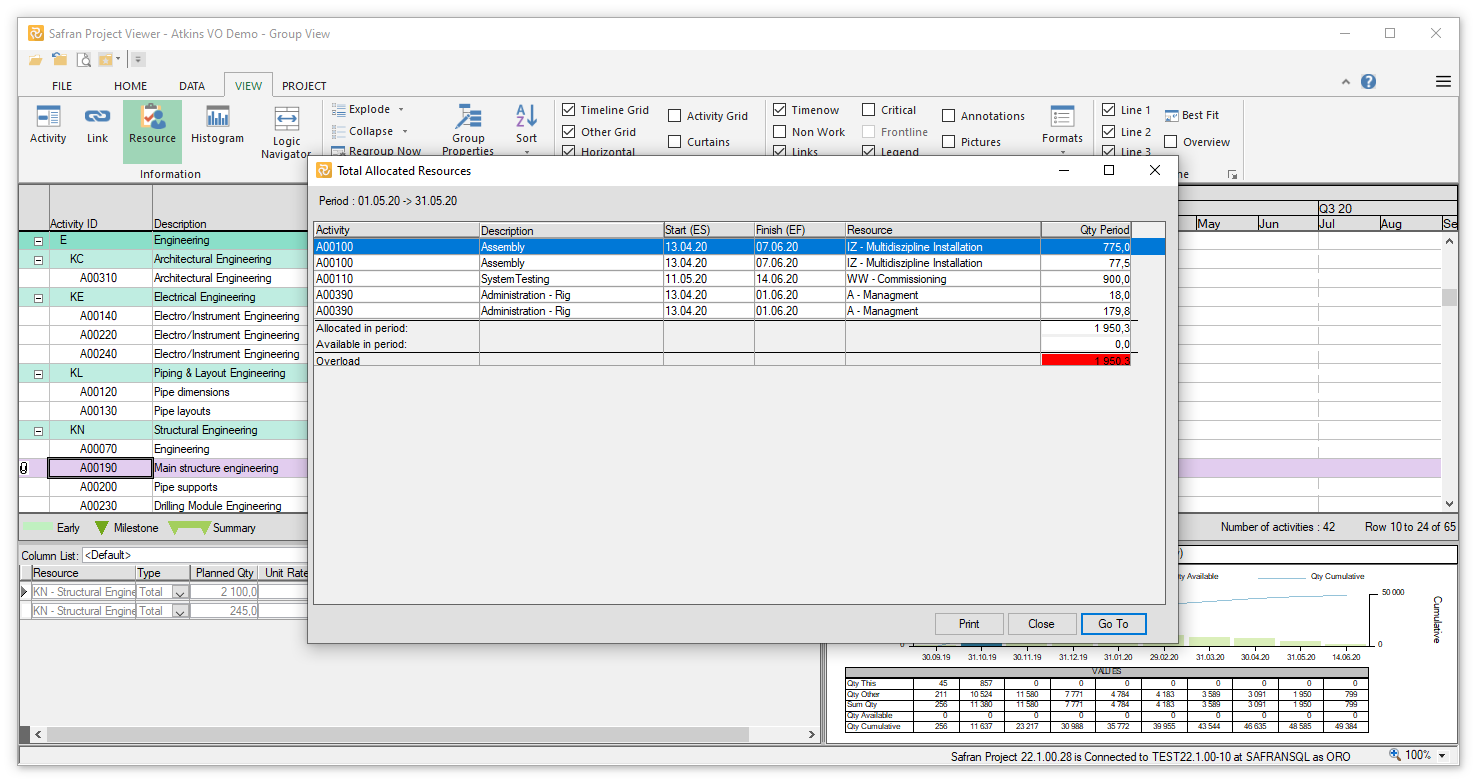
After double-clicking a resource bar, Safran displays a list of activities that meet the requirements for this period.
Histogram Information – The Safran Project Barchart contains a feature-rich histogram. In the Viewer, you can select previously saved histogram definitions and display different bars and line charts defined by other users. An associated shortcut menu lets you choose filters, set x-axis scaling online, and print a report from the Histogram view.
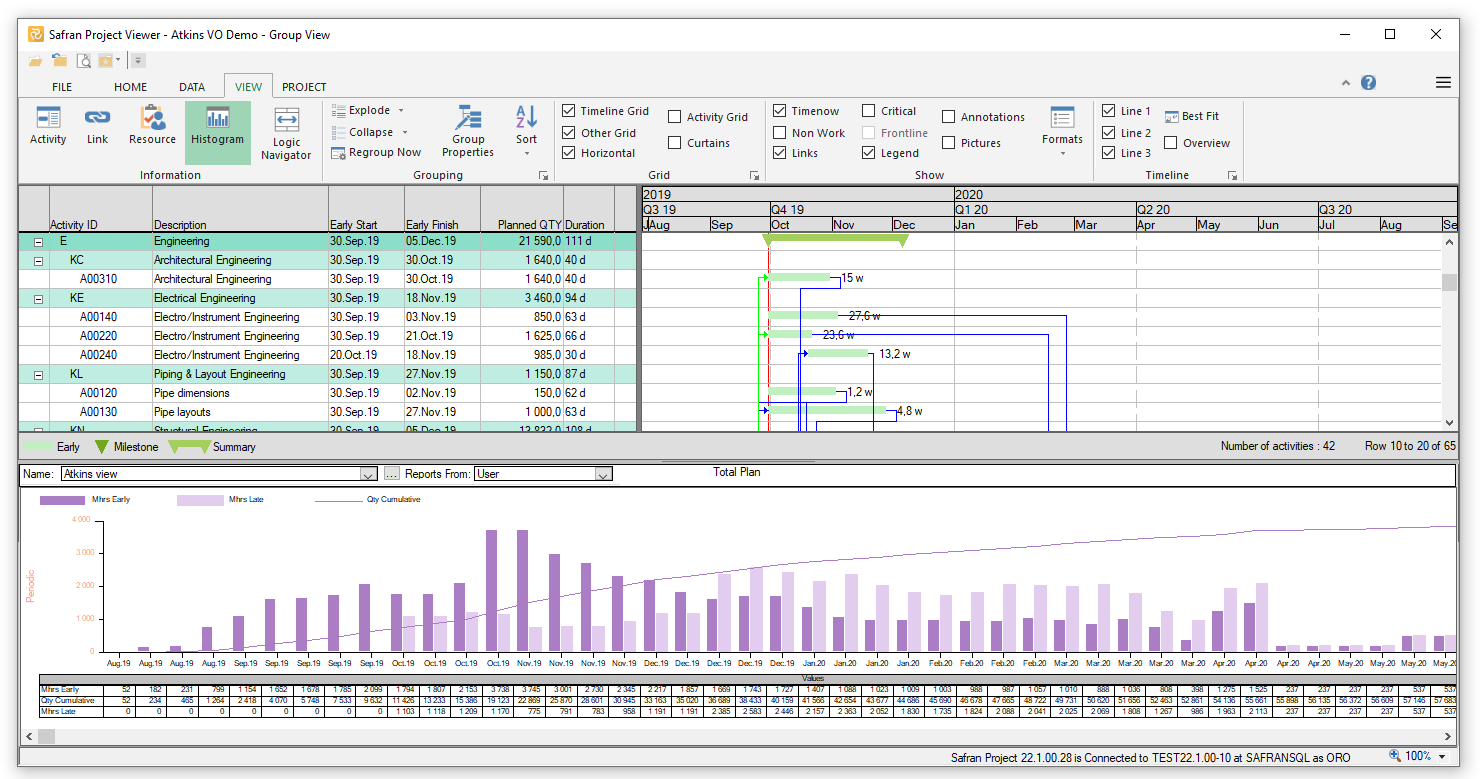
In the Editor Histogram View, select histogram specifications in the database from the drop-down menu.
The drop-down box lets you select from different pre-defined Histograms.
Logic Navigator Information is a more advanced logic tool than the Links window. It is divided into three parts: Information about the currently selected activity in the centre and information related to its preceding and succeeding activities.
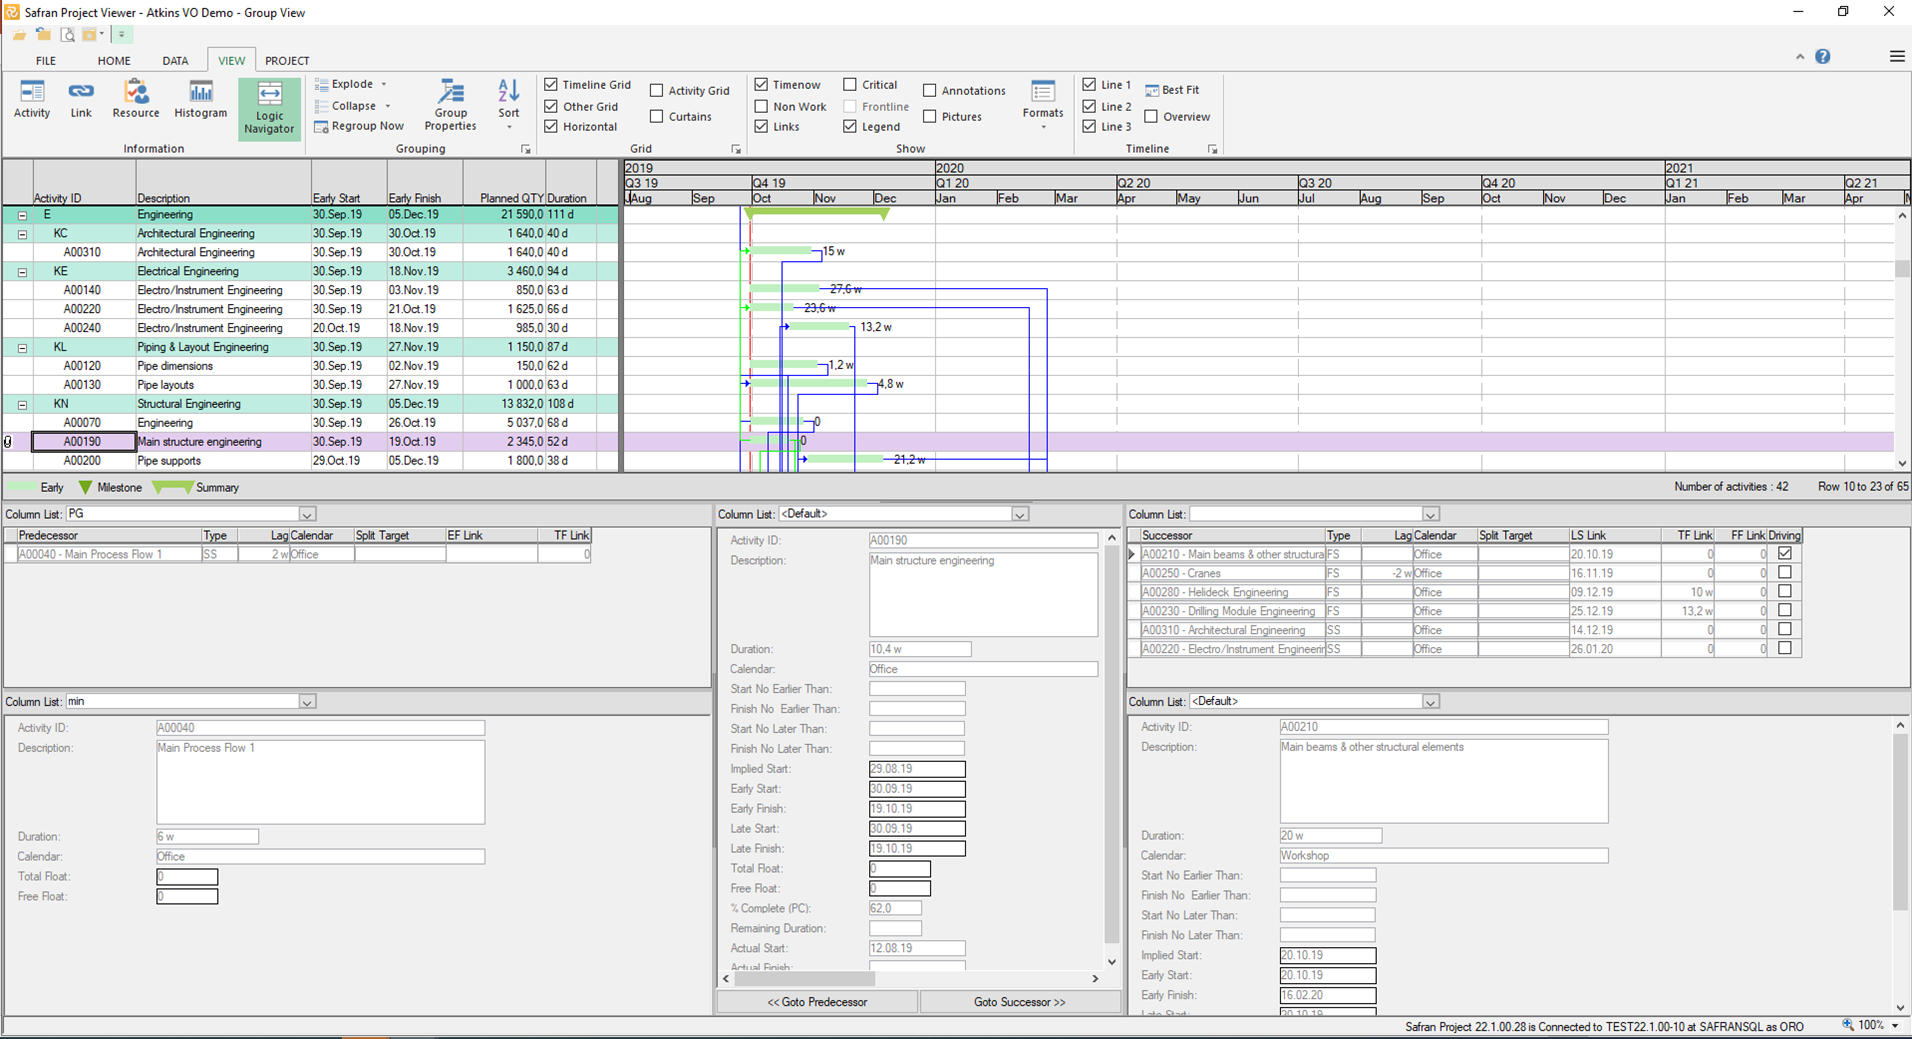
The logic Navigator.
You can change the fields or columns displayed in the different sections using column lists. Adding more columns to the sections allows you to read more data for the activity and its predecessors and successors as you browse the logic of the schedule. The column list must be defined by a Safran Project user, a system's owner, your PMO, or a project scheduler.
You can use the Goto Predecessor/Goto Successor to browse logic or by double-clicking a selected predecessor/successor.
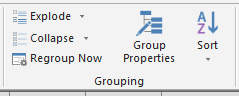
In the Grouping section, you find options that let you explode or collapse parts of or the entire schedule, define the Grouping Properties, and define the sort order. The sort function is a duplicate of the functionality described for the home tab. These functions can also be accessed using the shortcut menu.
The group properties are one of the definitions of the layout that you are allowed to change temporarily or save as part of your layout. If you change the Group Properties on a layout created by and owned by another user, you must use the Save Layout to store the changes.
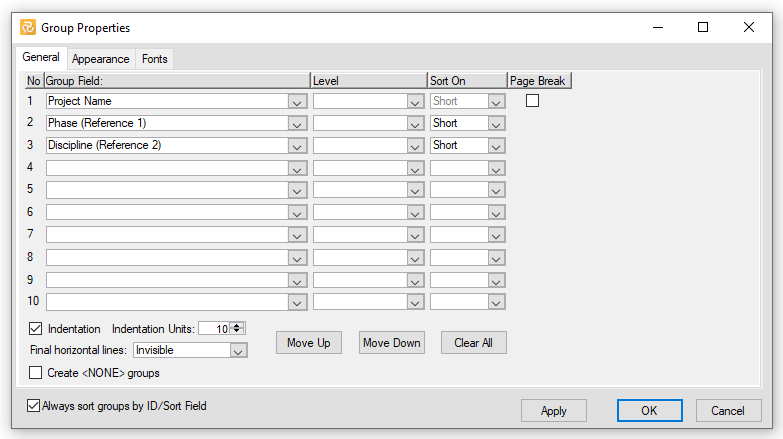
The Group Properties window.
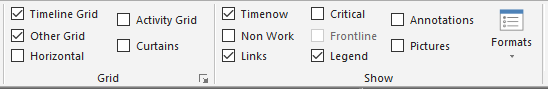
You can turn on or off defined grids and curtains in the Grid section. The arrow in the lower right corner gives you access to the Grids/curtains window in reading mode.
The options in the show section also turn on and off graphical representation for Timenow, non-working periods, links, critical activities, frontline legend, annotations, and pictures. The format options let you define the appearance of the same elements.
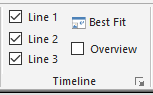
The Timeline section allows you to hide one or all three calendar lines, set the calendar line to Overview or best fit, and you can define the appearance of the calendar line.
Note: many of these options are also available through the shortcut menus.