.png)
# Risk Score — Evaluation Levels
Version: V26.0 (Beta)
Back to: Index
Overview
The Risk Score section is one of the most critical areas of the Administration configuration. It defines the evaluation levels and scoring matrices that determine how risks are assessed and scored across all projects, including the traditional risk assessment and the control effectiveness assessment. Changes here have an immediate, system-wide effect.
The page contains two tabs:
- Evaluation — configuration for risk assessment
- Residual — configuration for the control effectiveness assessment
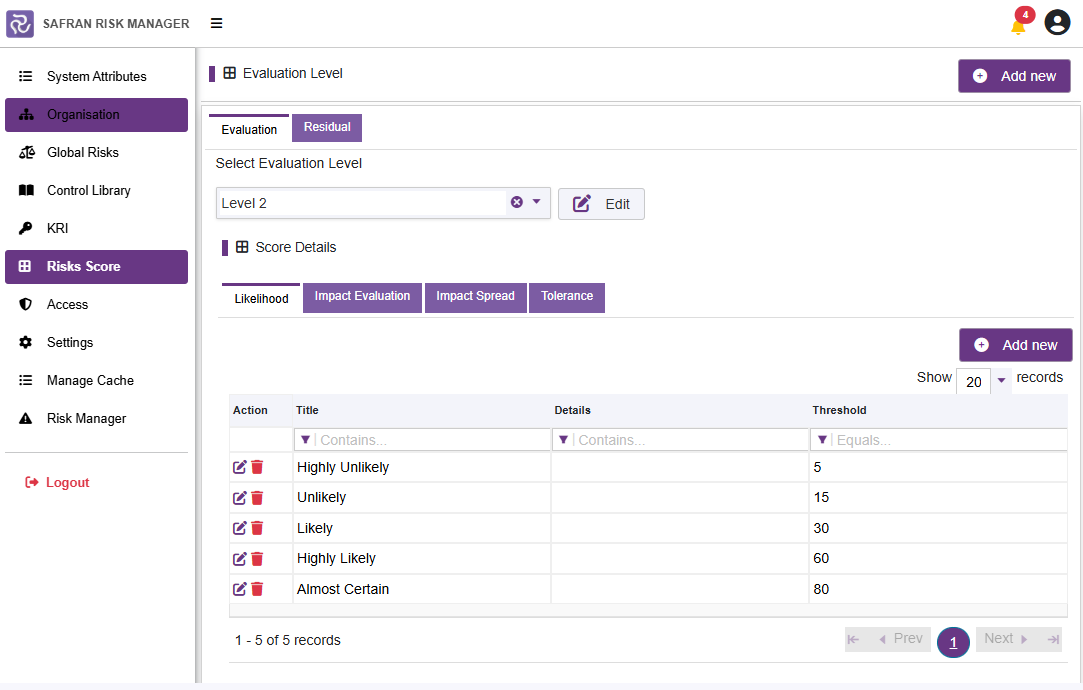
Evaluation Levels
An Evaluation Level defines a complete risk scoring matrix, including likelihood scores, impact scores, and tolerance thresholds. Multiple evaluation levels can be configured and assigned to different projects depending on their risk framework requirements.
To work with an evaluation level:
- Select an existing level from the Select Evaluation Level dropdown, or click Add new to create a new one.
- Click Edit to modify the selected evaluation level.
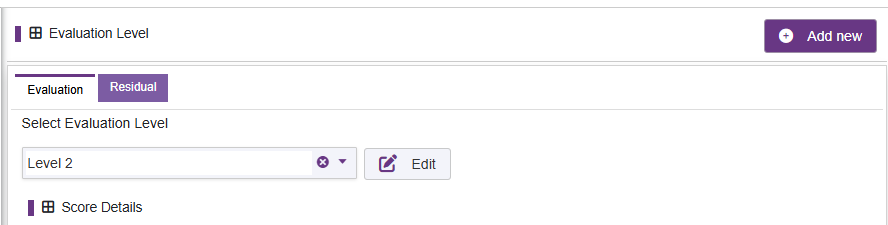
Warning: Changes to evaluation levels affect all projects using that level. Any changes to score values, tolerance levels, or the risk matrix will be immediately reflected in project risk scores. Exercise caution when modifying existing evaluation levels that are in active use.
Creating a New Evaluation Level
- Click Add new.
- Provide a name and description for the new evaluation level.
- Select the Use Absolute Evaluation (mandatory).
- Yes - The thresholds will be fixed in alignment with values entered. Use absolute values when creating the impacts (e.g. 1,000,000 for cost or 25 for days)
- No - The thresholds will be calculated from the project values as a percentage. Use percentage values when creating impacts (e.g. 1% of project value, or 5% of project duration)
- Click Save.
- The new level will appear in the dropdown and can then be fully configured.
Evaluation Tab
The Evaluation tab configures the traditional risk scoring matrix of likelihood and impact.
Key components include:
Likelihood Score
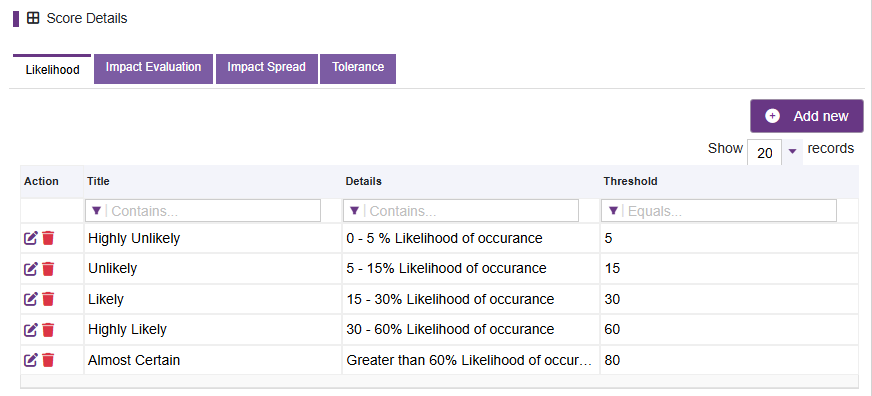
Defines the likelihood (probability) scale for assessing how likely a risk event is to occur. Each entry in the likelihood table includes:
| Field | Description |
|---|---|
| Title | The qualitative name of the likelihood level (e.g. Rare, Unlikely, Possible, Likely, Almost Certain) |
| Description | A definition to help users select the correct level |
| Score Value | The numeric value assigned to this level. This must be an integer value between 1 and 99 |
Impact Evaluation
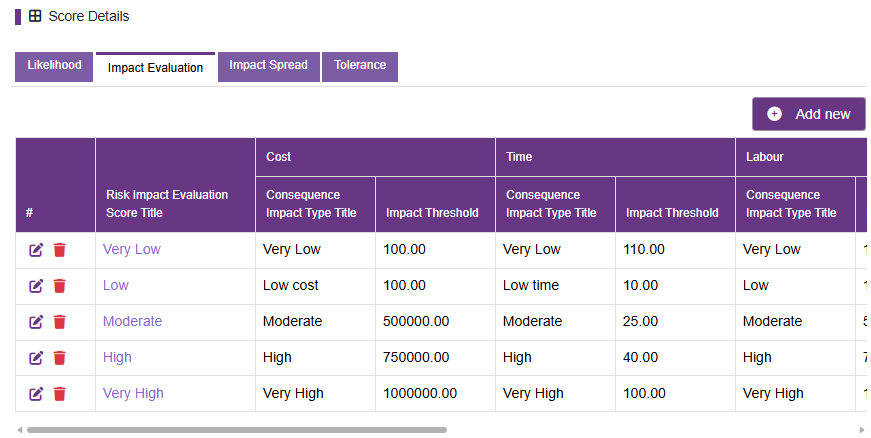
Defines the scale for assessing the severity of impact if a risk occurs. Impacts are typically configured per consequence type (e.g. Cost, Schedule, Safety, Reputation).
Note About Absolute and Relative Values
When creating the impact, pay particular attention to the type of assessment that the matrix has been configured to use.
If configured for Absolute then all values should be in whole numbers representing the impact value.
For example, a Cost impact of $500,000 should be entered as 500000.
For time impact, days must be used. So an impact of 5 days is entered as 5. For a month then calculate the equivalent days impact (for example 20 days).
If defining a qualitative assessment, the equivalent financial value should be defined within the threshold, even if the description is of a non-financial value.
If configured for Relative the all values need to be in the range 0 to 100.
For example, a cost impact representing 1% of the project value as defined at the project administration page would be entered as 1. If it is 0.5% of the project value, then enter 0.5.
The relative time impact is aligned to the Remaining project duration, based on the values entered at the project administration page from either "planned start date" to "planned end date" OR from "Actual start date" to "planned end date" if the actual start date has been populated.
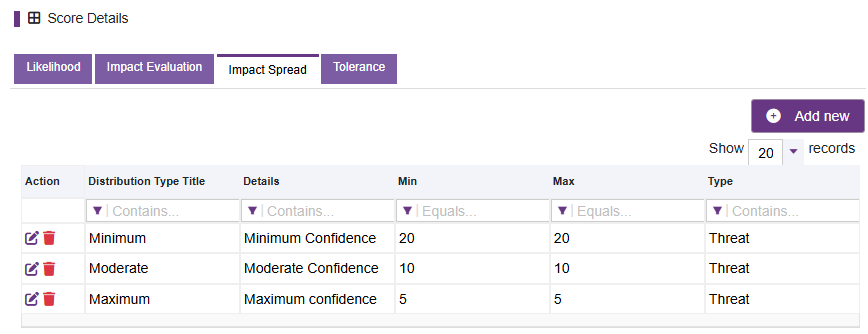
Impact Spread Score
Impact spread enables a qualitative assessment to produce a distributed value for the minimum and maximum around the impact assessment value as a percentage value.
For example, if the user has selected a qualitative value of 'high' with a value of 100 days, then the impact spread of 'moderate' (+/- 5%) would produce an equivalent distribution of Triangle(95;100;105).
It is advised to have at least three impact spread values, a Low, Medium and High. These should be considered against the question: How confident am I in this impact assessment? If confidence is low then the spread is wide. If confidence is high then the spread is narrow.
| Field | Required | Description |
|---|---|---|
| Name | Yes | The name which appears on the impact spread slider |
| Minimum | Yes | The lowest amount, as a percentage of the likely value, that the spread will have |
| Maximum | Yes | The highest amount, as a percentage of the likely value, that the spread will have |
| Type | Yes | Defines if the spread is used for threats or opportunities |
| Confidence Details | Yes | The description of the particular confidence spread |
Note The confidence spread does not need to be symmetrical. If your organisation has data that suggests a bias towards optimistic or pessimistic assessments, then it is possible to counter balance these with a negatively biased value.
Tolerance
Sets the risk tolerance boundaries — i.e. the thresholds above which a risk is considered High, Medium or Low. These values are used to colour-code the risk matrix.
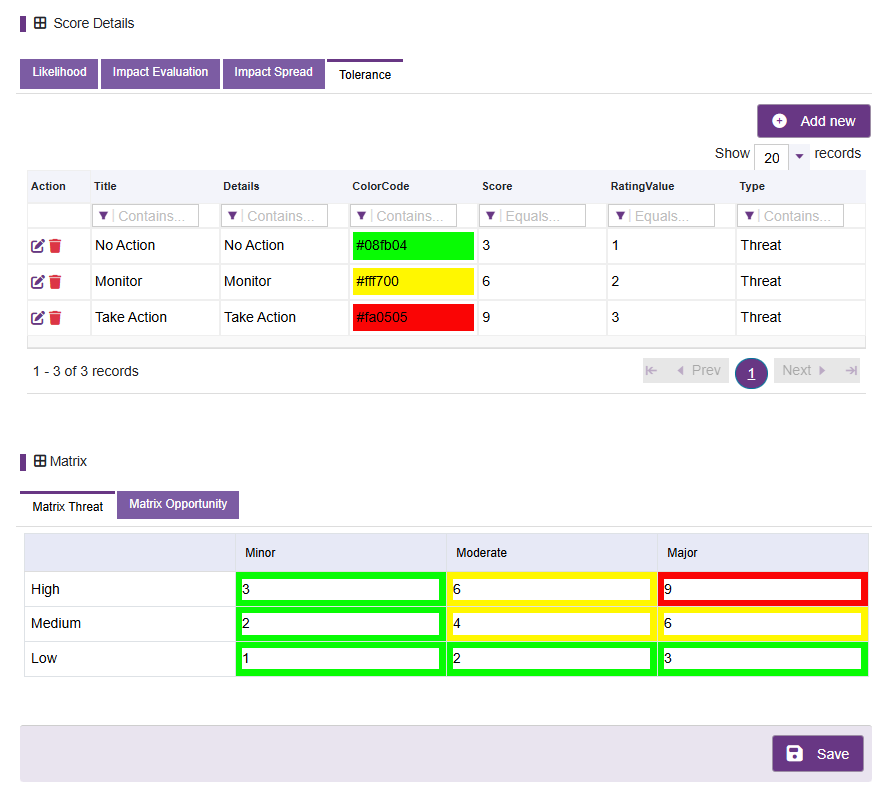
To add a new tolerance, press Add New and populate all fields
| Fiel | Description |
|---|---|
| Name | The name of the tolerance. For example "Monitor" or "Action Required" |
| Score | The value from the matrix UP TO which the colour will apply |
| Rating | Used in conjunction with the control effectiveness. The rating will be a value which corresponds to the severity of the tolerance. For example, a risk in the green zone will have a low rating (1) whilst a risk in the red zone would have a high rating (3). Use consecutive numbers to value the rating. |
| Colour | The colour of the cells |
| Type | Does this apply to the threat (negative) matrix or the opportunity (positive) matrix |
| Details | A description of the particular tolerance value |
In the above example, three tolerances have been identified, green, amber, red. This will be evaluated with a rating of 1,2, and 3.
Risk Matrix
The Risk Matrix is a visual grid combining likelihood scores (rows) against impact scores (columns). Each cell is colour-coded according to the tolerance thresholds as set above.
The numbers in each cell of the matrix can be customised.
Popular combinations are row multiplied by column:

And a diagonal incremental number system:

Observe how the number colours change even though the tolerance bands themselves stay the same.
Residual Tab (Optional)
The 'Residual' tab is used for the assessment of control effectiveness and is closely tied into the Evaluation Matrix, but represents a different type of assessment.
During the Risk Tolerance set up the user was asked to create a risk rating for each of the colours (input 1).
The concept behind the residual rating is that for each risk, the user assigns a level of control effectiveness (input 2) based on the settings in this tab (for example, 1 for highly effective and 3 for low effective).
With the two inputs (control effectiveness and risk rating) the result is plotted on a matrix such that the High risks with Low control effectiveness score higher than the Low risks with High control effectiveness.
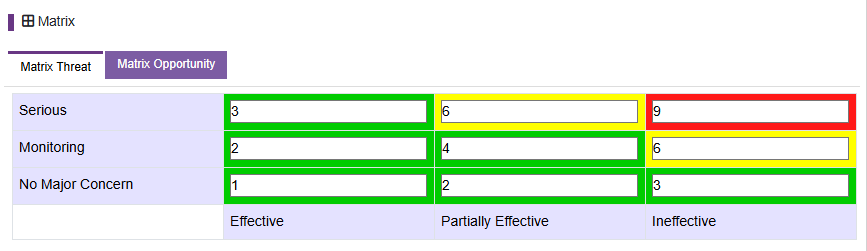
Select Residual Evaluation Level
To modify an existing residual evaluation level, select it from the drop-down menu. To create a new evaluation, press Add New.
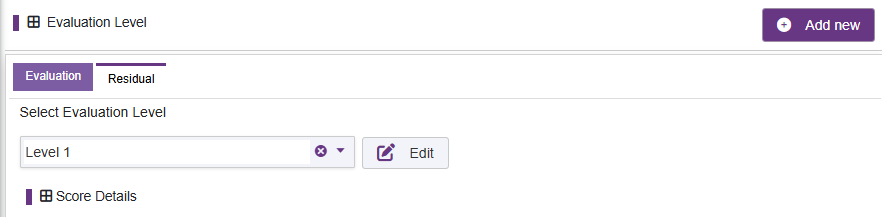
Populate the new Residual Evaluation with a Name and a Description. Once created, locate the new evaluation in the drop-down menu and select it.
Control Effectiveness Tab
The control effectiveness tab enables the user to edit or add new effectiveness ratings.
| Field | Description |
|---|---|
| Effectiveness Rating | The name that the effectiveness will display |
| Effectiveness Score | The value of input into the matrix for control effectiveness |
| Colour | The colour assigned to the effectiveness. This will be displayed against each risk when they have been assessed |
| Details | The description of the control effectiveness |
Edit can also be used to Delete any unwanted assessments that may no longer be required.
Residual Effectiveness Tab
The residual effectiveness tab allows the user to determine the names and colours of the matrix for both threats and opportunities.
| Field | Description |
|---|---|
| Name | The name of the zone within the matrix |
| Score | The value up to which this zone is effective to |
| Rating | The value assigned to this zone |
| Colour | The colour assigned to this rating |
| Type | Either negative (threat) or positive (opportunity) |
| Details | A brief description of the zone |
The Residual Matrix
Once both of the above inputs have been defined, the user can now populate the matrix with appropriate values. Remeber to add values to both the threat and the opportunity aspects.
Once the matrix has been populated, remember to press Save.