Brief Introduction to Safran Project
User interface
As a new user, your first impression of Safran Project will likely be one of familiarity. Its interface resembles that of a Microsoft Office program, complete with a set of tabs, ribbons, and a quick-access toolbar. This similarity is designed to make you feel comfortable and at ease as you navigate the software.
The user interface enjoys a tab design that takes you from the first stages of creating a project plan to delivering various reports.
Rest assured, we will walk you through the functionality and details of the user interface in the upcoming modules, providing the support and guidance you need to navigate the software effectively.
Login
When you start Safran Project, you must log on to the database that stores your projects. To log in, you need a user account and password to the database. You must contact your Safran Project Administrator, who will give you access if you are a new user. In addition to username and password, you need to know what kind of database system the database is running on (Microsoft SQL Server or Oracle), the server's name and the database you will use. Your IT department or a Safran Administrator will provide this.
Safran Project Personal vs. Safran Project Enterprise
Safran Project comes in both Personal and Enterprise versions. The actual project planning functionality is identical in both versions.
Safran Project Enterprise is made for multiuser environments, where you must log on to a central database (MS SQL Server or Oracle) to access the data. Other users in your company may have access to the same data, allowing you to work on the same projects simultaneously.
Safran Project Personal is primarily for single-user usage. It is shipped in a package with a local database (Microsoft SQL LocalDB). When you log on to the database to access your data, you log on to a local database stored on your computer or a network file share. This limits Safran Project so that only one user at a time may work with the data in the database. As this database is usually located on your computer, it serves the opportunity to work offline. Safran Project Personal also supports logging on to corporate databases if you need access to a multi-user environment.
Dates and Plan Sets
For newcomers to Safran Project or planning in general, it can be confusing as to why there is not just one start date and one finish date for every activity.
Safran Project uses the principles of project planning to calculate, for every activity, the earliest possible start and finish dates and the latest possible start and finish dates to preserve the calculated project end date.
In addition, Safran Project keeps several concurrent sets of dates, as follows:
- Original: a permanent record of the first baseline
- Baseline: the dates from the most recent baseline
- Current: remaining work as per the last cutoff
- Live: planned dates referencing Timenow.
The Live plan set will change immediately every time you alter an activity. The Live plan is the one you work with up until you set the original baseline.
All these plan sets can be used to report on, so it is worth spending some time understanding what each plan set represents.
Other possible plan sets include the Revised Plan, Forecast Plan, and Alternative Schedules.
PROJECT SETUP
Creating a New Project
Clicking on the 'New' icon in the FILE ribbon, which is the starting point for creating a new project, will take you through the New Project Wizard, where you can create your new project plan. The wizard lets you select between three options for making your project plan and doing the basic setup: Create New: Project, Project Group or Project from Template.
Setting project properties
The New Project Wizard will guide you through setting up the project in three main steps project details, userfields and resources. When you finish that, you also need to set up your calendars and symbols. Remember that large companies typically use defined sets of calendars and symbols, which should be used in all projects. Nevertheless, you might sometimes need to set different configurations for your project, for instance, if your project has unique work hours or non-standard holidays. Safran allows you to modify the project configuration anytime through PROJECT > Properties.
A brief introduction to calendars
Each project must have a calendar set assigned to it. There can be one or more calendars defined in a single calendar set. You can define different calendars for different job parts in the same project. If you are building and installing a module for an offshore oil installation, you can have one calendar defined for the onshore work and a different calendar for the offshore work. A calendar is defined by work hours per day, workdays per week, and finally, non-working periods (weekends, holidays, etc.).
A brief introduction to symbols
Each project must have a symbol set assigned to it. The symbol set holds the symbols that are used in the barchart (Gantt view) diagram. The symbol set controls how and when the symbols are drawn (both the visual configuration of colours and shapes and the specification of dates for when a symbol will be drawn).
A brief introduction to resources
You can assign a resource set to the project (it's not mandatory, but we strongly recommend you have a resource set). The resource set can contain several different resource definitions, each of which can be Cost or Quantity. In addition to this, you can also assign a unit rate to each resource definition. Using a resource set can help you manage and track the resources used in your project more effectively.
A brief introduction to userfields
Safran Project holds user-configurable fields that can be labelled to suit your requirements. These fields are available for storing data specific to your project or company for use in your plan. Userfields can also perform computations and conditional tests on project data to generate various helpful outputs for your plan.
In short, the userfields enable you to add your fields and values for activities. Once defined in the userfield setup, the userfields are available for reporting in the Barchart Editor.
You may add up to 680 different userfields for each activity. They are split up into the following userfield types:
- 100 Reference Fields
- 100 Text Fields
- 100 Date Fields
- 100 Flag Fields
- 100 Decimal Fields
- 100 Duration Fields
- 30 Outline Codes
- 50 Computed Fields
User interface
Safran Project provides a user-friendly environment for viewing and working with your data. The interface, consisting of a quick-access toolbar and four panes, is designed to empower you and make you feel confident in your ability to use the software effectively.
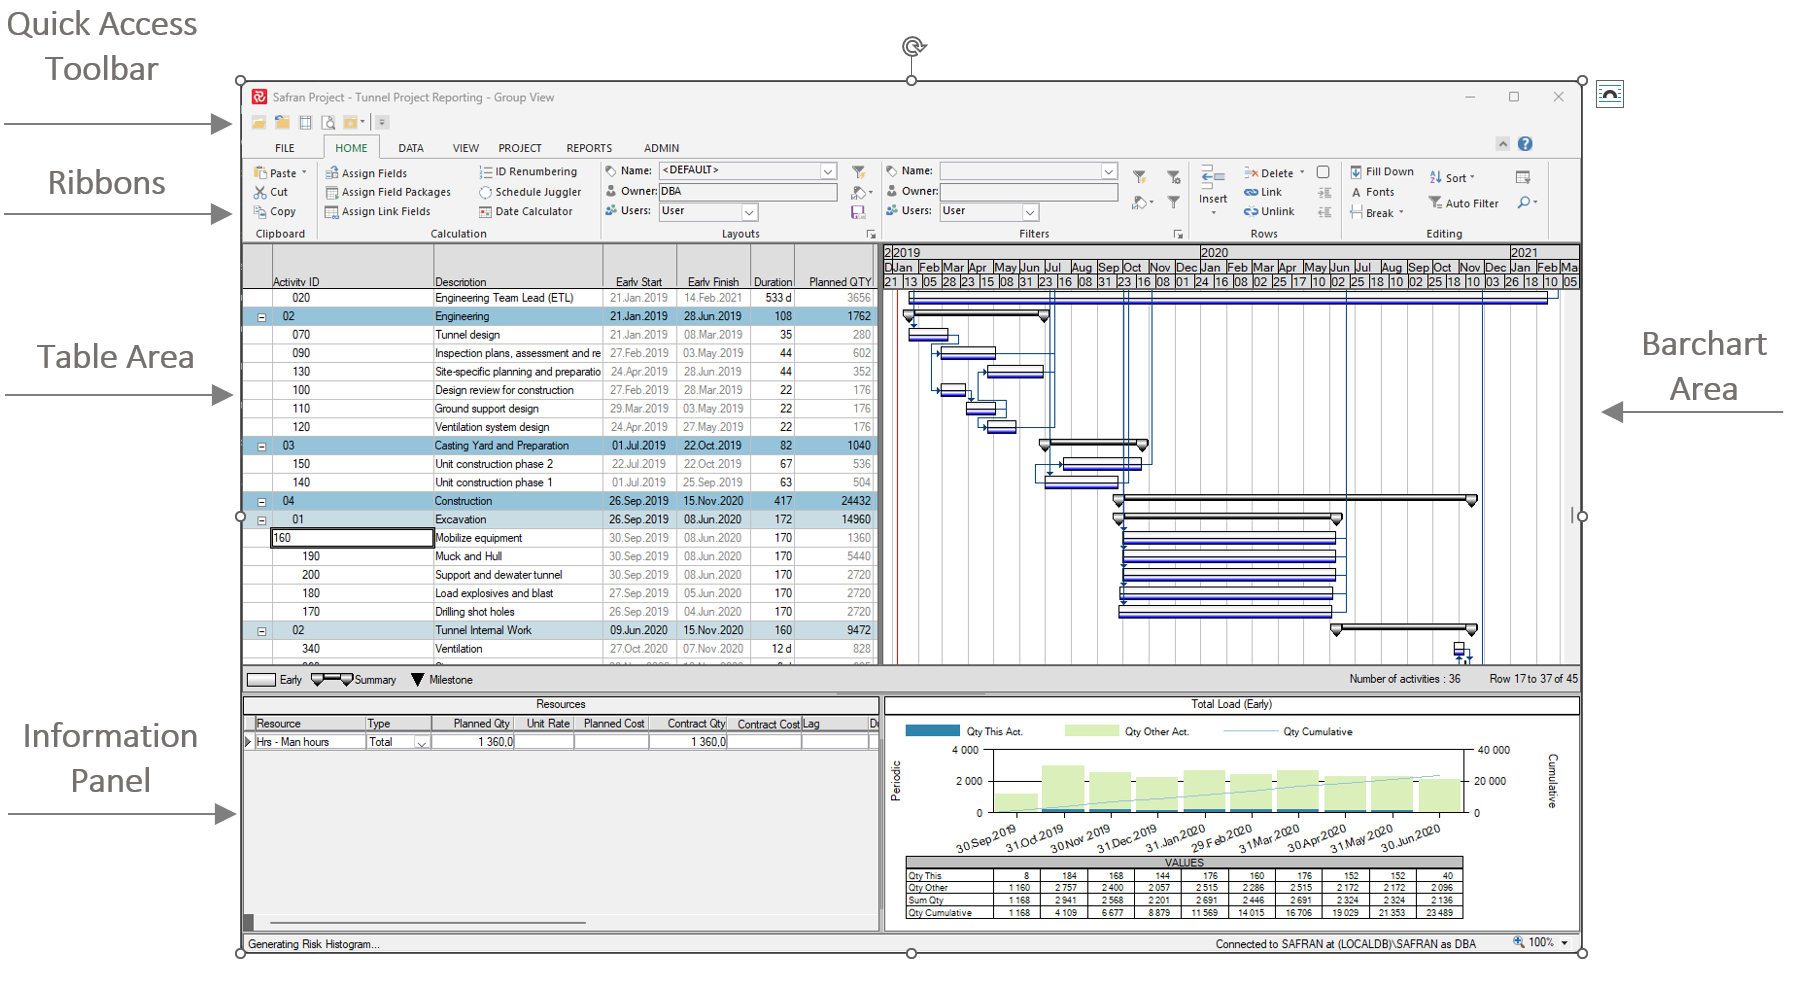
Quick Access Toolbar
A handy, small, customisable toolbar independent of the other tabs. You can select the commands you want in the Quick Access Toolbar by clicking the arrow icon to the far right of the toolbar. Click on the left-hand side of the command you want to show or hide in the drop-down menu that appears.
Ribbons
The ribbon menu is separated into tabs by functionality and holds all the functions you need to use Safran Project. Ribbons provide easy access to the commands you need to work on your project. In some sections of the ribbon menus, you will notice a  symbol in the lower right corner. Clicking this symbol will take you to a setup screen for this section.
On the far right of the ribbon menu, you will find a shortcut to the Safran Project Help and an arrow to minimise the ribbon menu.
 If you minimise the ribbon menu, you can restore it by clicking the arrow.
Table area
The table area gives you a listing of the activities in your plan. You can access most of the information stored for each activity in the table area. This is done by adding columns to show the information you want and hiding columns with information you don't need to see. We recommend that you only show the columns that are important to you. What information is essential changes based on the type of work you are doing. To simplify this, you can create and save layouts optimised for your different work operations. To add or hide columns in the table area go to VIEW > Columns > Columns...
Barchart area
The barchart area gives you a visual representation of how the project is planned in time. For an optimal presentation, we use a Gantt chart. The barchart area has a timeline on top of the Gantt chart. To change the zoom level on your timeline, you can click and drag the timeline to the left or the right until you are happy. You can also double-click on the timeline. Double-clicking on the timeline opens the timeline configurator. You will notice that you can enter a start and finish date, but you must check the Overview checkbox to make the dates control the timeline span. All timeline settings can be found under VIEW > Timeline.
On the timeline setup screen, there is a checkbox called Best Fit. This only works if the Overview checkbox is also checked. By checking Best Fit, the timeline will start on the Early Start date of the project's first activity and finish on the Early Finish date of the project's last activity. You will notice that with Overview and Best Fit checked, and the Gantt chart will dynamically zoom in or out to show the entire project span when you resize the Barchart area.
You must notice that you cannot zoom in or out on the timeline by clicking and dragging if the Overview checkbox is checked.
Information panel
You'll find the information panel at the bottom of the Barchart Editor. This part of the screen can show detailed information relevant to the activity currently selected in the table/barchart area. You can also change the selected activity in each of these information windows. You can choose between:
- Activity information
- Link information
- Resource information
- Histogram
- Schedule Risk
- Logic Navigator
To select any of these, go to VIEW > Information. The currently selected view will be highlighted. To hide the information panel, click the highlighted view once more.
In the Activity Information window, you are presented with a quick overview of essential information for the currently selected activity. The first four tabs show general information about the activity, constraints and schedule options, progress and analysed schedule dates. The rest of the tabs hold userfield data.
Link information shows detailed information on what activities are linked to the current activity (the activity that is selected in the table area). Predecessors and successors are separated respectively to the window's left and right parts of the window. In addition, you will be able to see the link type/dependency type, planned delay for the link and more.
Resource information will show what kind of resources, if any, are associated with an activity. It will also show Planned QTY for each resource, unit rate, cost, and more. In the initial planning phase, the Resource information view can be used to add Planned QTY and Planned Cost. On the right side of the window, a resource histogram is shown. You can change the size of the histogram by clicking and dragging on the line that separates the two parts.
The Histogram, often called the Editor Histogram, is ideal for showing a histogram based on different quantities (QTY) and cost measures—more on this in the reporting chapters.
The Schedule Risk will allow you to perform various risk analyses while you are working on your project. (This feature is not a part of standard installation).
The Logic Navigator gives you an efficient way to review your activity data, especially concerning the project logic.
User Settings
Under the PROJECT ribbon, you'll find the User Settings on the far right. This setup window holds many convenient settings that make Safran Project easier to use. You can set default values for Duration, Calendar, Qty Resource, Date format, Fonts, etc. and a highlight colour so that the activity you selected in the Barchart Editor is highlighted with a colour of your choice.
Navigating Safran Project
In addition to the ribbon menu, you can also use keyboard shortcuts or right-click to access many functions.
Keyboard shortcuts are shown in menus next to the function or when hovering over a function in the ribbon menu.
Right-click can be used in several places in Safran Project and will provide easy access to functions relevant to your right-clicking area. Try right-clicking on the column headers in the barhcart area or specific activities in your plan. You will see that you are presented with different functions to select depending on where you right-click. This can also be used in the Gantt chart, on the timeline and in the Legend bar above the information panel.
This course will focus on using the ribbon menu, but feel free to explore different ways of navigating through the software.