Grouping, Summarizing, and Organizing the Schedule
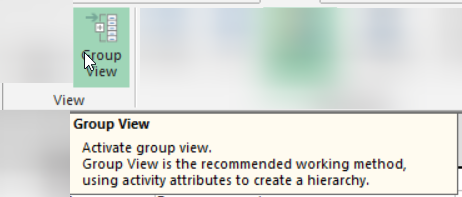
Using the Group View, you can summarize or “roll up” project data into groups of activities to simplify its presentation. Safran Project displays summary information in activity columns for each group in the barchart, and displays summary activity bars as one continuous bar or a detailed bar to distinguish planned work from periods when no work occurs. In Safran Project, you can group activities in the Barchart View by Reference field, Text fields, Outline codes and Flag type Userfields. When you define the group properties, Safran organizes the activities into clusters or groups. Safran Project displays one summary row of subtotals in the Activity Columns and one matching summary bar in the Barchart. By using the expand/collapse features of the Barchart Editor, you can specify that you only want to show subtotals for individual groups. Alternatively, you can select to display unique bars for each activity. Safran displays a summary row of subtotals and several bars for each activity in the summarized group.
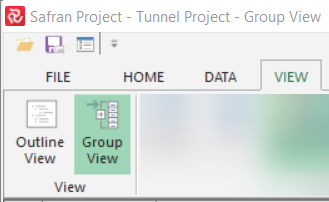
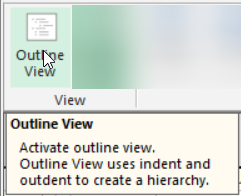
An Outline view is a non-coded hierarchical structure. Safran Project uses outlines to subdivide a schedule into large work segments and then increasingly smaller amounts of work. The groups of work segments can represent phases in a project, rooms within a building, or specific buildings in a large construction site. When you outline a project, the Barchart Schedule becomes easier to read, and you can locate individual activities quickly. An outline looks similar to Activity Grouping because it is hierarchical. However, unlike grouping, no codes are associated with titles or descriptions. In addition, you do not specifically assign codes to activities in an outline.
Creating an Outline
Creating an outline organizes the project activities into groups of activities. Each group is preceded by a summary task, which describes the tasks within the group. Each level provides information of greater detail. Using Safran Project, you can build a non-coded structure into your project by creating a hierarchical structure as you go. The process of structuring the activity list is called outlining. The groups created in the activity list can represent phases, areas, construction sites, performing companies, or any other common feature.
You will enter each level of the outline as an activity. An activity changes to a summary when an activity below it is indented. When an activity becomes a summary, the duration, start, and finish dates change to summarize the information of the sub-activities. For example, the start date of the summary is equal to the earliest start date of the sub-activities. You can add activity information, such as duration and description, to activities at the lowest level.
Define Group Levels (Group Properties)
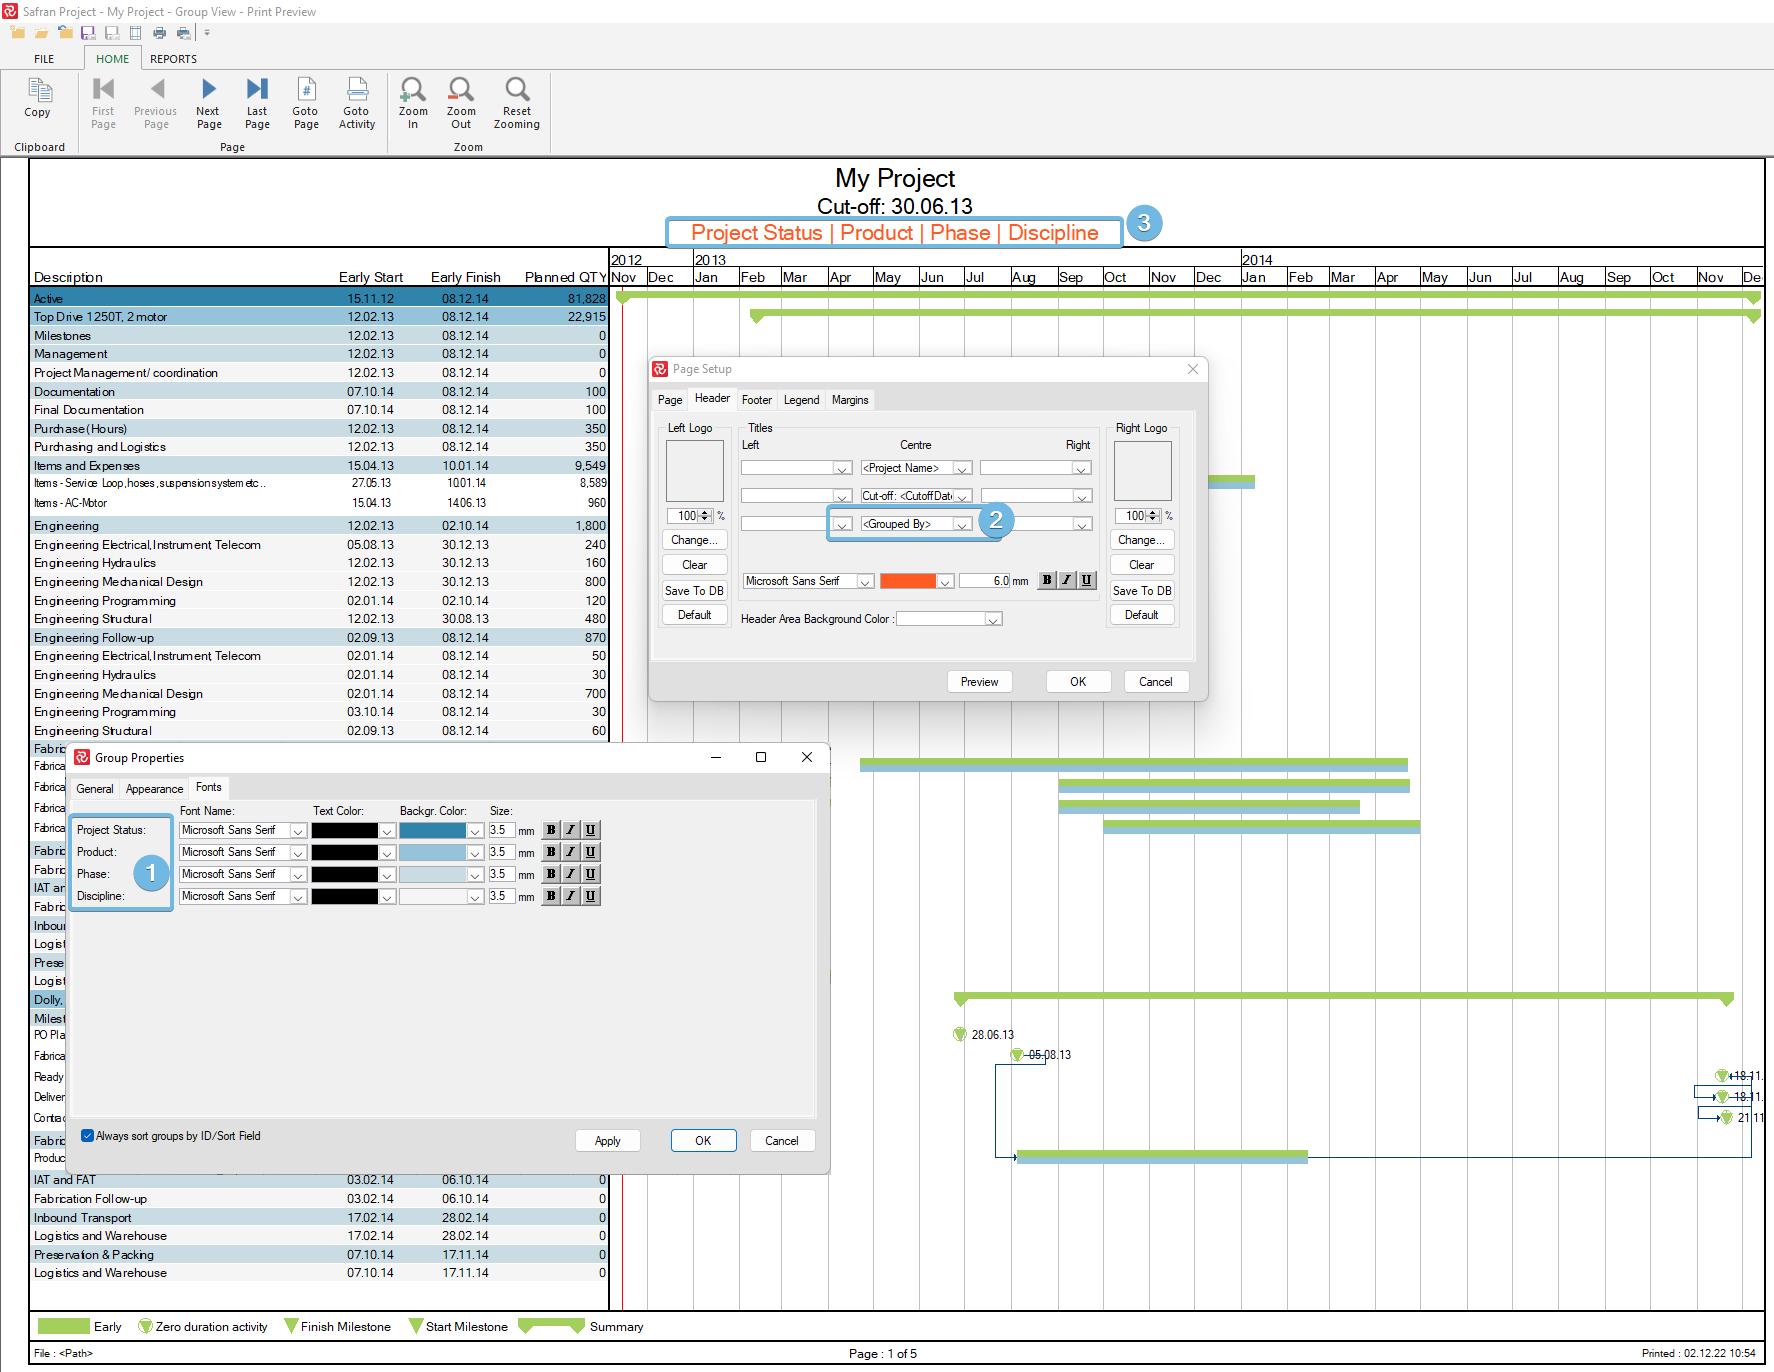
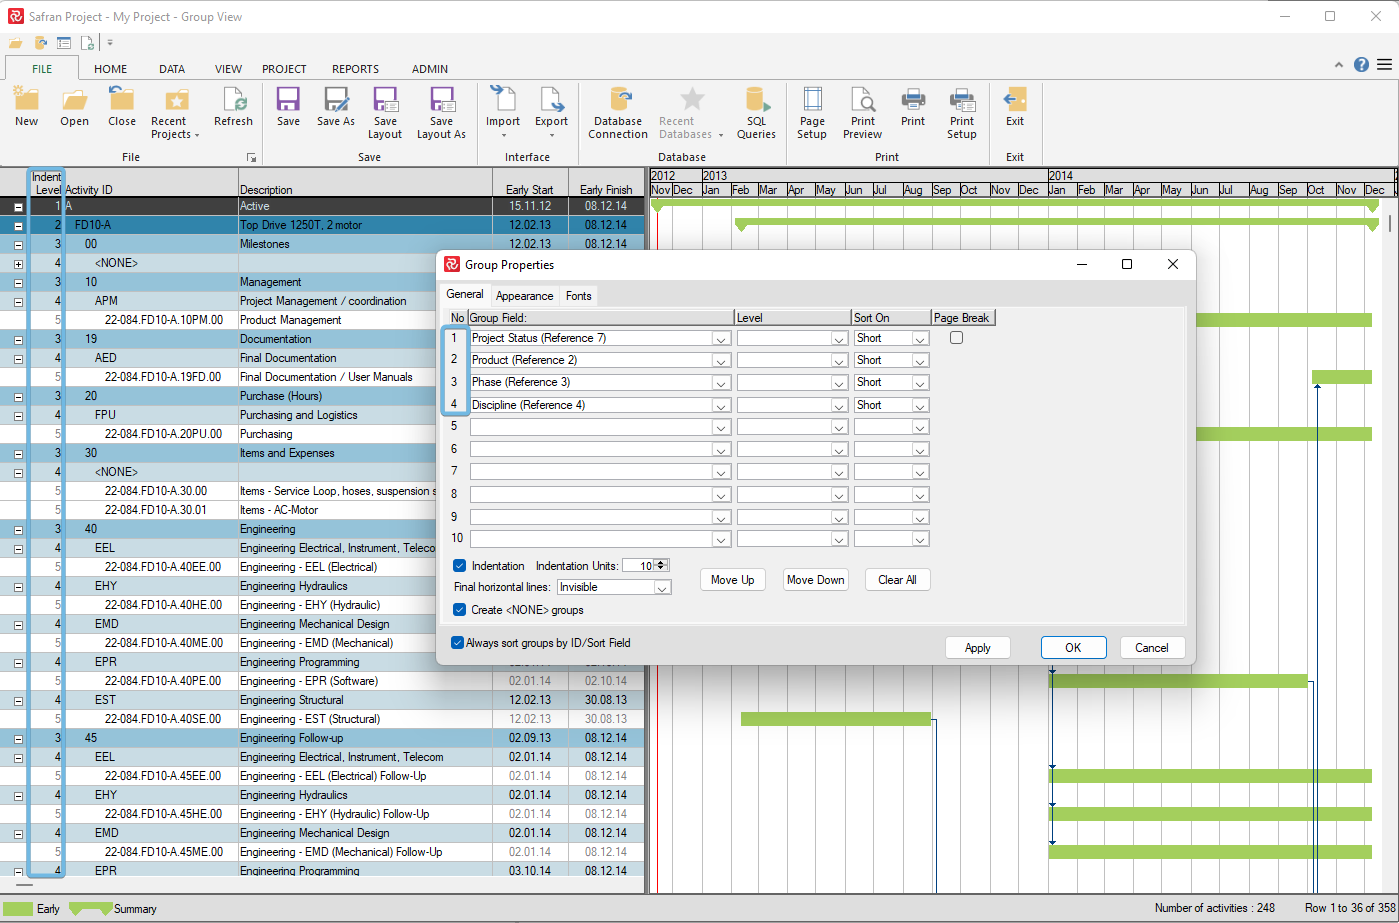
To define the summary structure and properties, choose ‘Group Properties’ from the VIEW ribbon, or select Group Properties from the short-cut menu in the barchart area. The Group Properties window is a tab-separated window that lets you define group fields and levels, appearance and font, text color, row background color, and size. The general tab provides a panel to determine 10 group levels by selecting summary or level fields from Project, Reference fields, Outline Codes, Text (string fields), and Flag fields. It is a powerful feature. For the Outline codes, you can select code level. You may specify a page break or page throw for the highest summary level and set the final horizontal lines to be drawn. You can also control indentation and select to sort summaries alphabetically by ID.
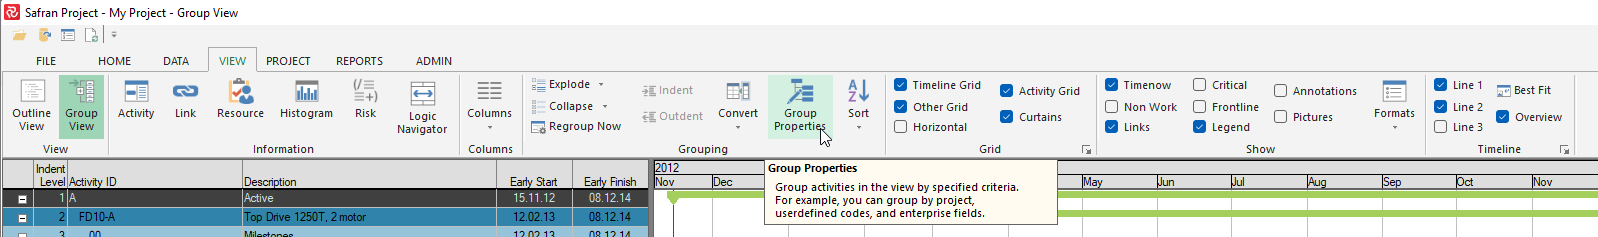
By marking ‘Create NONE groups,’ Safran sorts activities without any values specified for a subset into NONE groups. This advantageous feature improves readability and helps structure the project.
The 'Level' column will become active when grouping on outline codes.
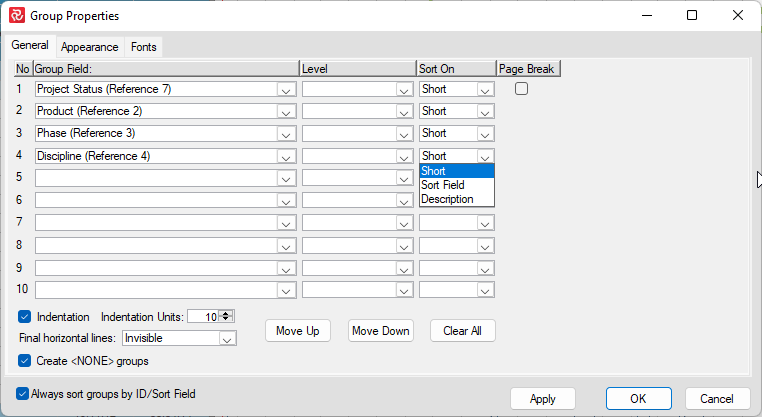
To Configure Summary Appearance
Choose the Appearance tab from the group properties window and specify the appearance of each summary. Attributes include how the layout should be opened regarding groups or details, if dates, numbers, frontline drawing, and visibility of reference and flag fields are to be summarized and displayed on the different levels, and the option to add final horizontal lines.
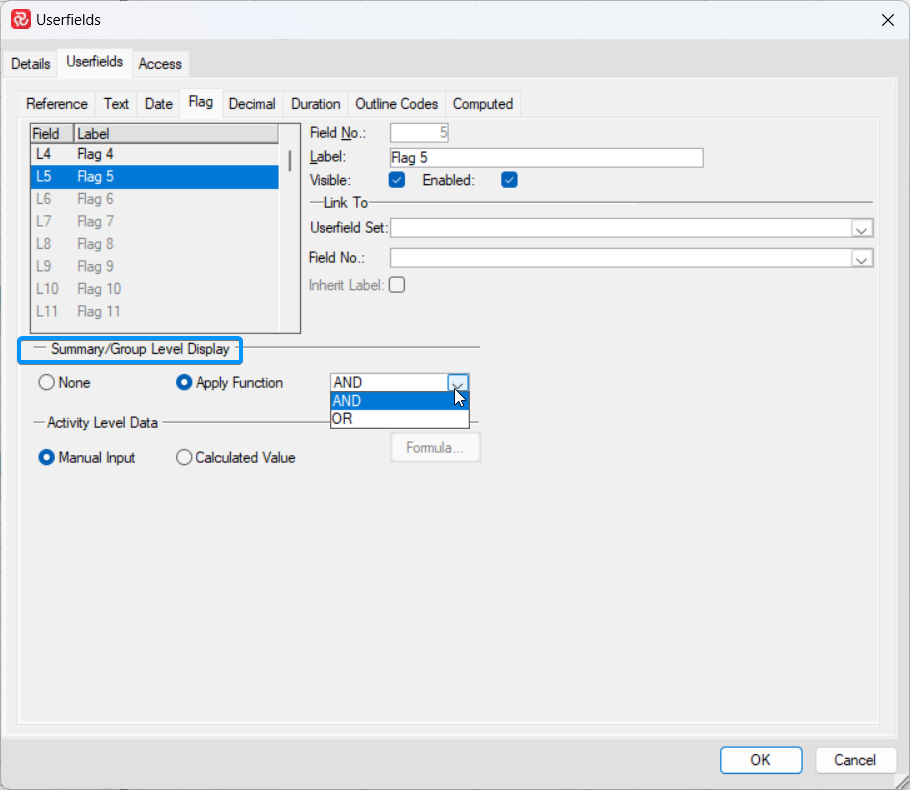
Note that summary Flag-fields appearance are shown in accordance with the userfields setup:
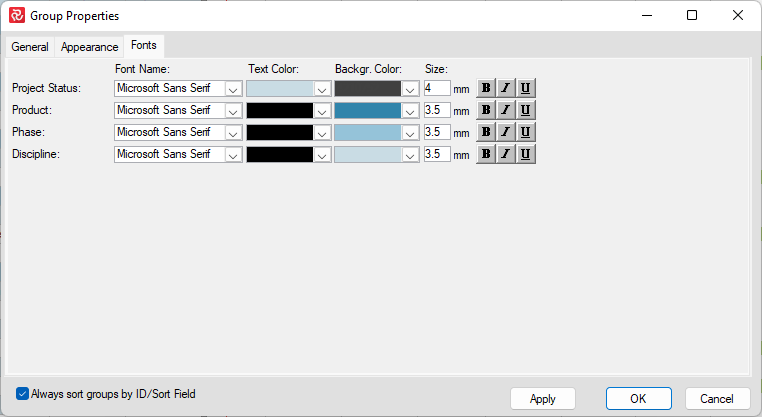
To Configure the Summary Row Fonts and Colors
Choose the Fonts tab from the group properties window and select the Summaries tab to choose color, font, and other font attributes.
Configuring Summary Symbol Attributes
After defining the summary and grouping levels, you can define or customize your summary bars. Select to open the Symbols window, select the summary symbol, and choose the Group tab to specify the summary bars attributes. Usually, you would define a summary bar to have a different look than the activity bar. The summary bar spans a group of activities from the first early start to the last early finish of the activities within the group.
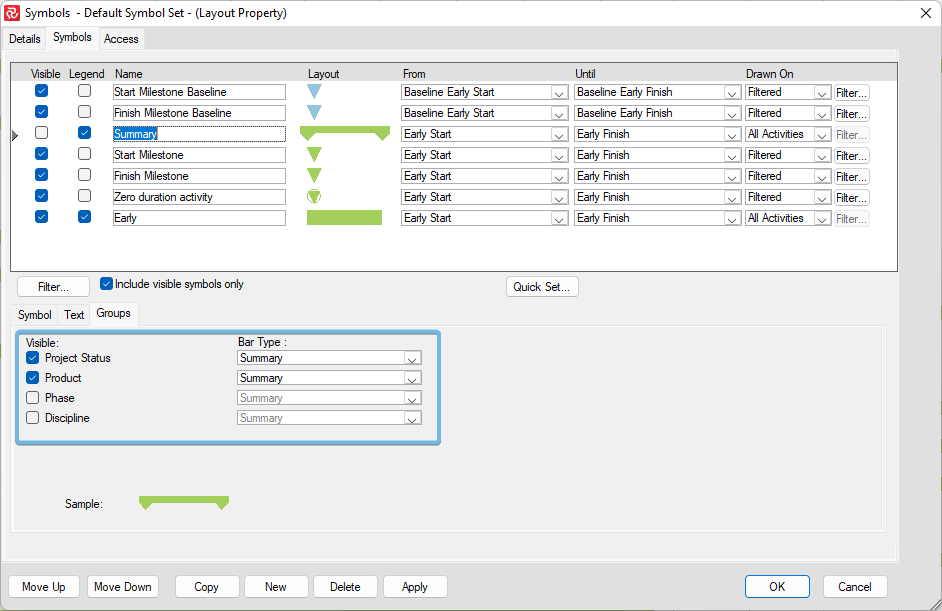
To define the summary bar, mark it as not visible. Select span dates from the General tab, determine the layout and attributes from the Symbols tab, and specify visibility from the Group tab, which enables you to draw summary bars for all or select summary levels.
Summary Bars
When you specify a summary bar, Safran Project shows a continuous bar for each summary group.
Necked Bars
As with activity bars, the summary bars can also be necked. This means it draws a thinner bar when time off or holidays are observed.
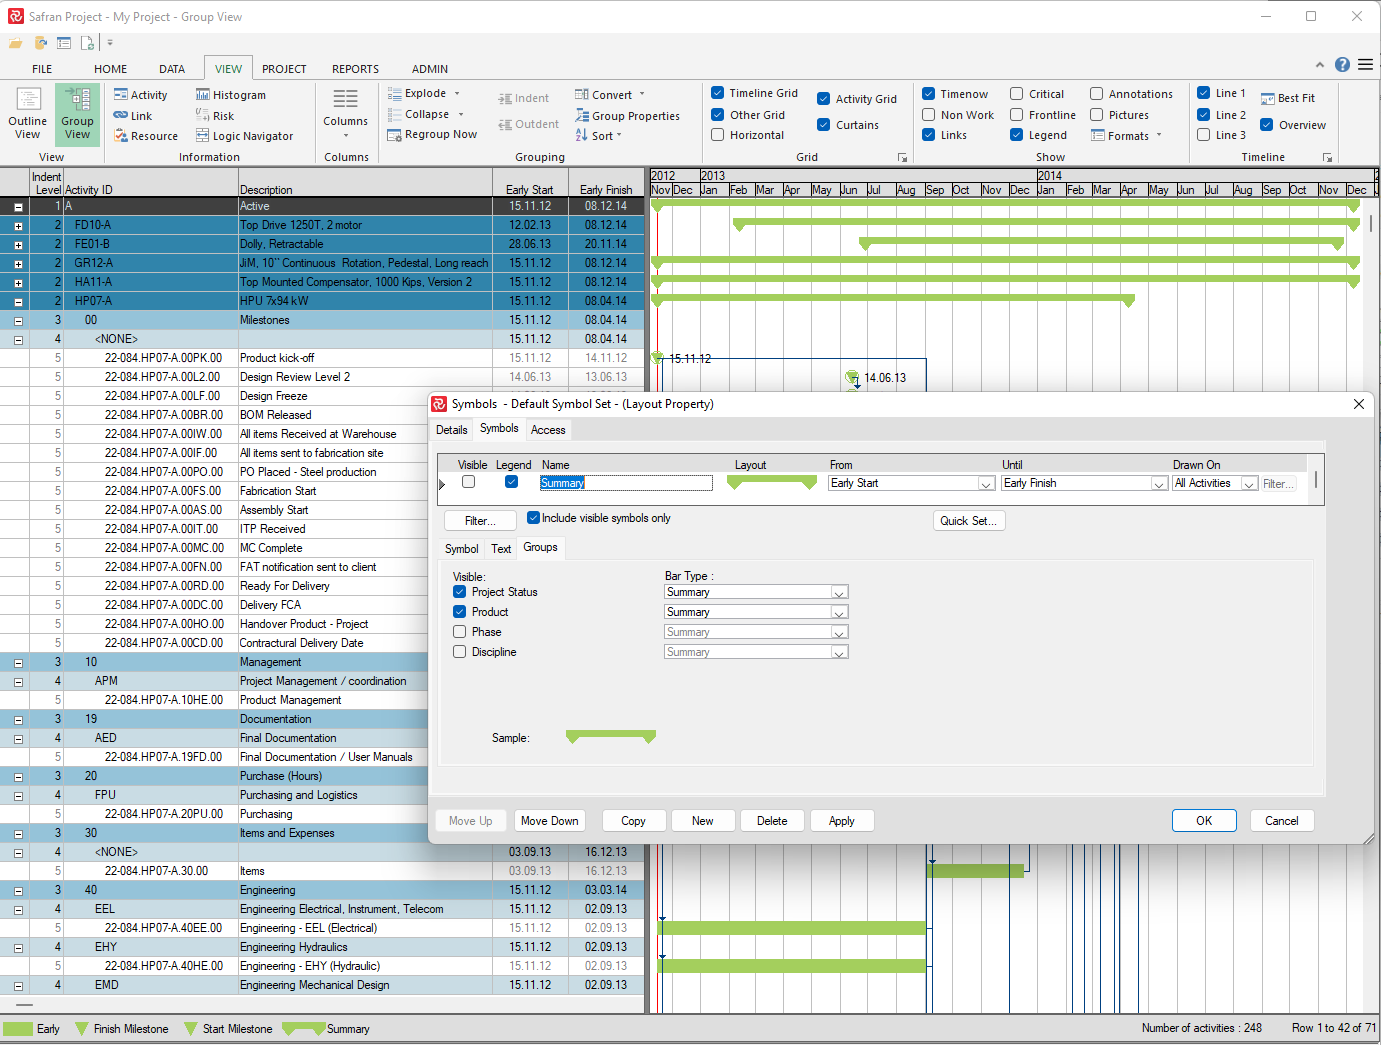
Hide or Show Details
Details of the grouped schedule can be hidden or shown using the Group Explode and Group Collapse options or the equivalent symbols next to each summary level. You can collapse or explode any of the summary levels individually. Click the outlining symbols (+/-) to expand or collapse any section or row. The plus sign (+) represents a collapsed level or section, and the minus sign (-) tells you it is an expanded section or group.
You may also collapse or expand entire groups by selecting the Explode/Collapse Options from the VIEW toolbar, or by choosing Group Explode or Group Collapse from the right-click short-cut menu.
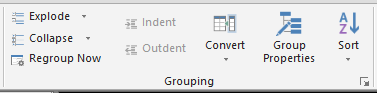
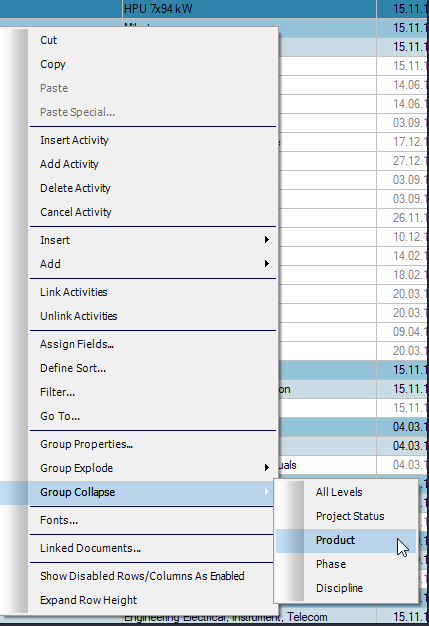
This menu option lets you show or hide entire groups with a single click. Since group definitions are stored as part of Safran Project layouts, shifting between layouts with different summary structures is a quick, powerful, and convenient way to view your project from different perspectives.
Modifying Group Levels
If you want to group and order your plan differently, select the Group Properties option and change the Group By fields to suit your new requirement. Safran Project redraws the barchart and rearranges your schedule in real-time.
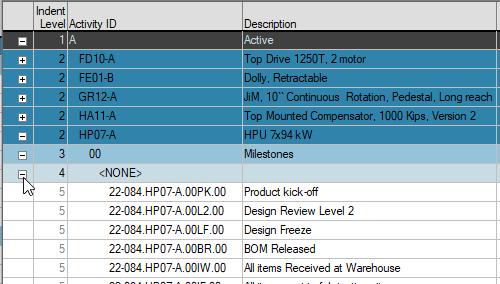
Column Indent Level vs. Group Properties
Adding the 'Indent Level' column to your layout allows you to sort your schedule when exported to Excel.
In the example below, the Activity appears as Level 5 because only four levels are defined in Group Properties. The activity level number will change accordingly if you have more or fewer groups defined. Note that you should tick the 'Create None group' box to ensure consistency in the activity level number.
Tip: The Indent Level field might also be helpful in Conditional formulas.
Grouped by in Header in Barchart Editor Print Report
To visualize the 'Group Properties' in the Header of a Barchart Editor Print Report, add the