Performance Chart
Effectively managing a project is a many-layered process. A number of components, metrics, indexes, and charts need to be monitored to assess your project's performance. Performance reporting and indexes are part of an Earned Value Management System (EVMS). Two indexes are widely used and accepted as performance measures for a project: the Schedule Performance Index (SPI) and the Cost Performance Index (CPI). The SPI measures the project efficiency, and the CPI measures cost (or quantity) efficiency.
The SPI is the Earned Value vs. Planned value. A figure above 1 is favorable. The CPI is the ratio of the Earned Value to the Actual Cost or Actual Expenditure. If the resulting value exceeds 1, the project's cost-efficiency conditions are favorable. A resulting value of less than 1 indicates that the conditions of cost efficiency for the project are less than good.
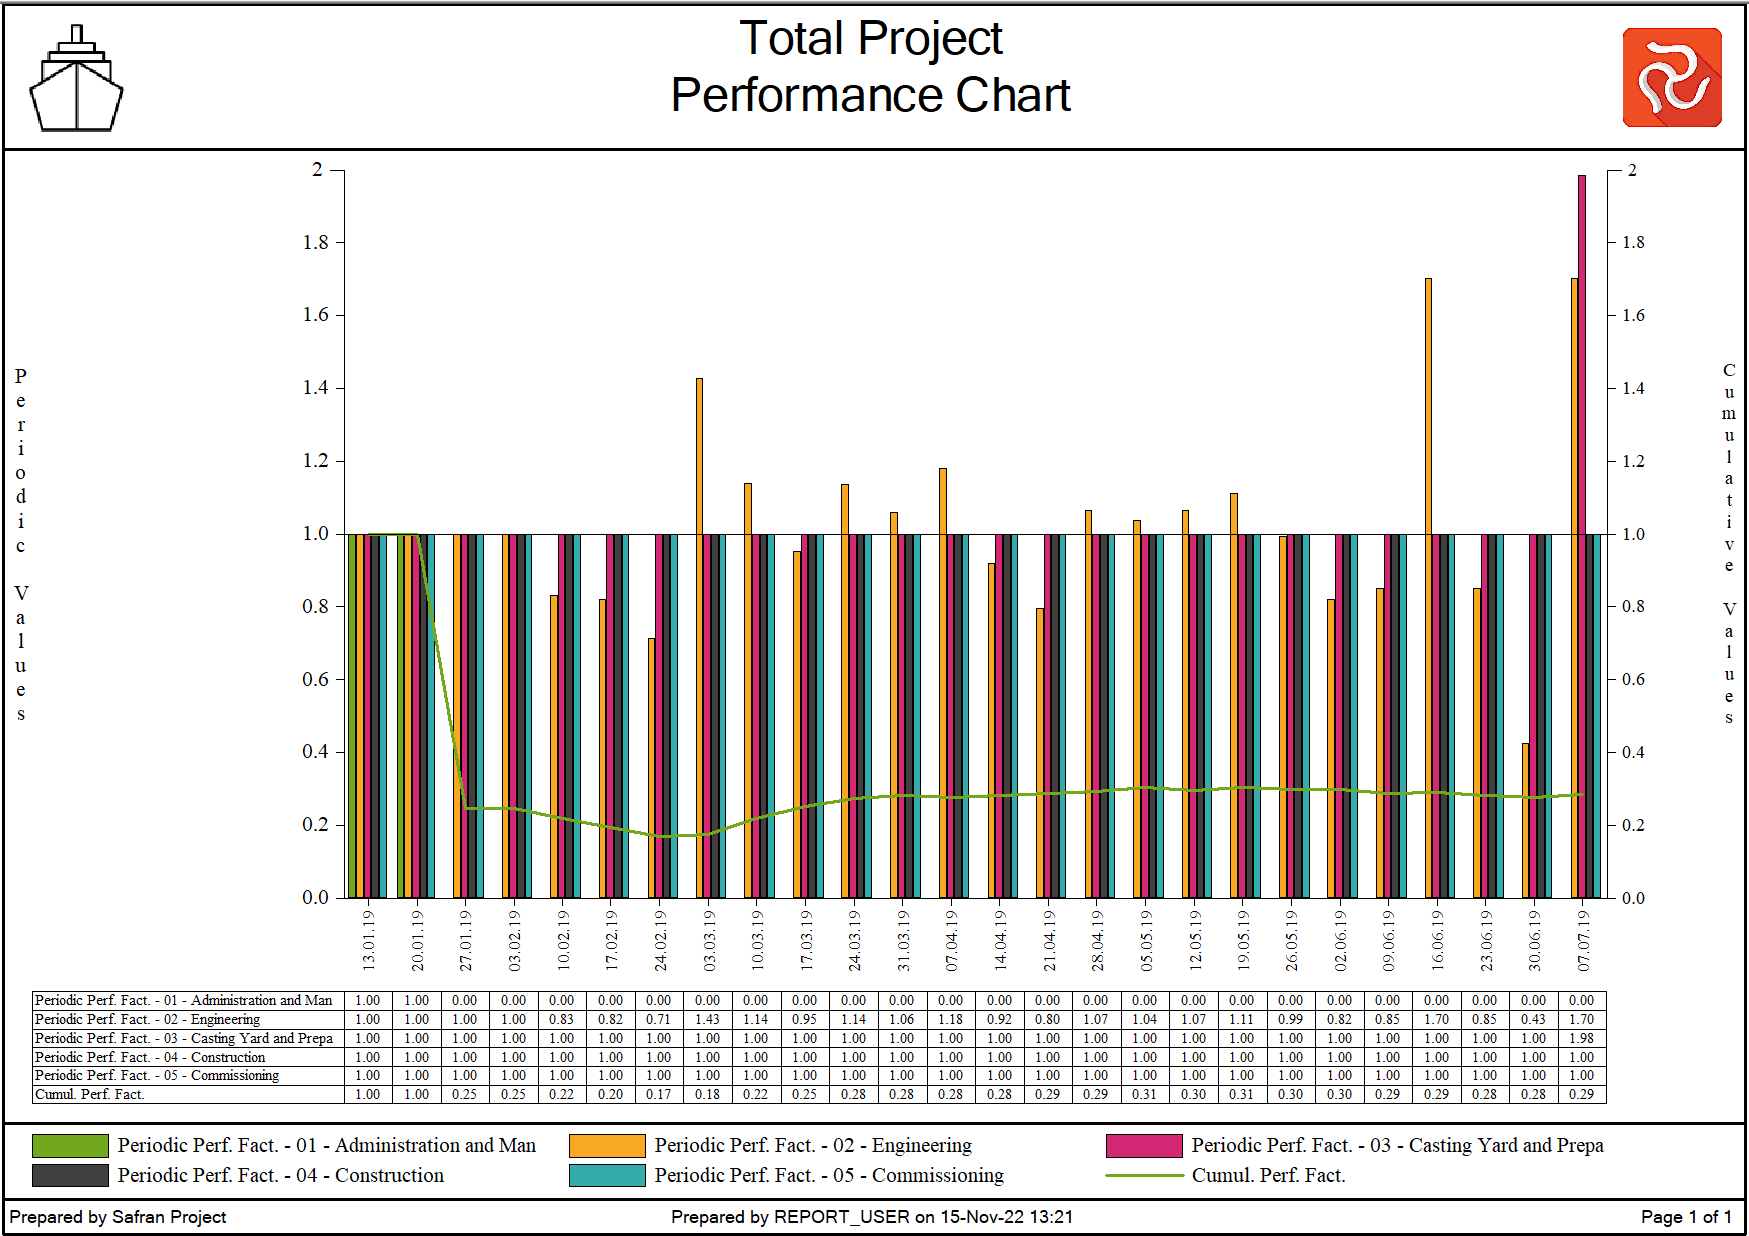
To monitor your project's performance, direction, or trend, these indexes are often plotted on a time-scaled chart—a Performance Chart—where you can view both the cumulative and periodic values.
Another type of performance chart is The Bull’s-eye report. Instead of plotting cumulative CPI and SPI values against a time axis, the values are plotted in a CPI-SPI matrix. For portfolio and program reporting, the Bull’s-eye report supports trend lines per project and a summary line for the entire portfolio. The third performance chart is the program and portfolio Bubble chart.
The Performance Chart configuration is a tab-separated window with most of its functionality inherited from the Histogram/S-Curve report. We recommend studying the ‘Preparing, Viewing, and Printing Reports and Graphics’ for details on the Titles and Filter tabs. For more information on the Reports and its sub-tabs, we recommend studying the ‘Histogram/S-Curve Reports’ section.
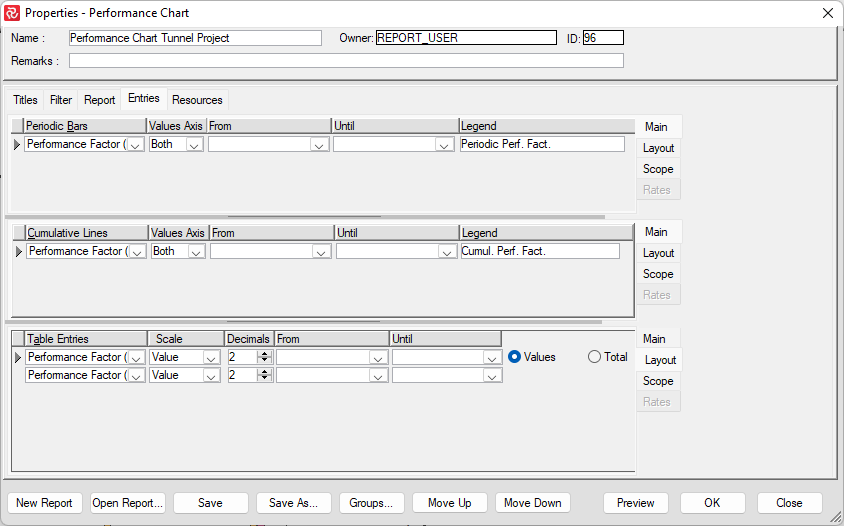
Five entries are available for periodic bars, cumulative lines, and table data. In addition to the performance and schedule indexes, you will find a performance factor and a schedule factor. The factors are available to meet the requirements in the (geographical) markets where performance is computed as Actual/Earned and Planned/Earned. Using the factor figures below, one is considered to be favorable.
| Entries | Description |
|---|---|
| Performance factor (AC/EV) | Actual expenditure/Earned. |
| Schedule factor (PV/EV) | Planned Value/Earned. |
| Performance index (EV/AC) | Earned/Actual expenditure. Compliant with EVMS specifications. Values above 1 are “good”, and below 1 are “bad.” |
| Schedule Index (EV/PV) | Earned/Planned Value. Compliant with EVMS criteria. Values above 1 are “good”, and below 1 are “bad.” |
| To Complete Performance Index (TCPI) | The TCPI value indicates the required performance to complete the project within budget. Values above 1 indicate that you are falling behind and must increase performance to complete within budget. The To Complete Performance index—TCPI—is calculated as Work remaining/Budget remainingTCPI = (Budget - EV) / (Budget - AC). |