Progress Status Report
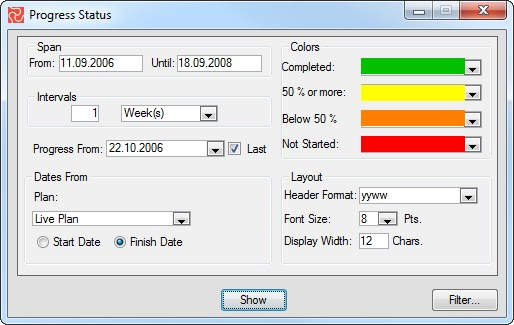
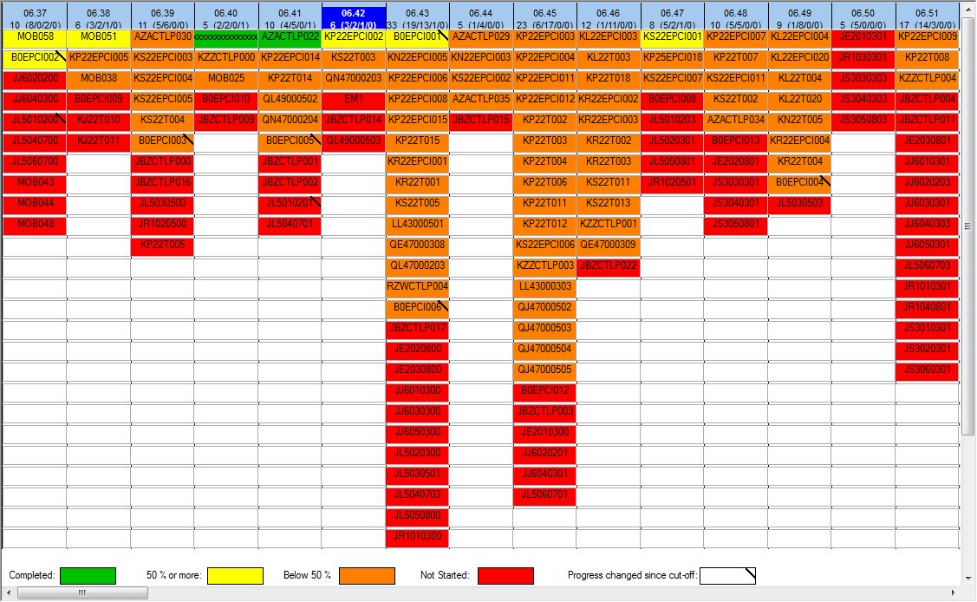
The Progress Status Report is a color-coded report that organizes activities by period. The periods can be set to Weeks, Project Months, Calendar Months, Quarters, and Years. Activities will be sorted, grouped, and displayed according to start or finish dates by the selected periodic interval. You can choose the colors used for completed activities, progress above 50%, progress below 50%, and activities not started. The default colors are green, yellow, orange, and red.
Each column represents a period (week, month, etc.), and each cell in the report represents one activity. The color-coding provides a visual tool that lets you easily see the status of each activity. The activities can be grouped by start or finish dates. You can apply a filter and select data from the Live Plan, Revised Plan, and Baseline Plan. The top border of the report shows the period number and a summary of the number of activities not started, below 50% complete and above 50% complete/completed. The current cut-off period is highlighted in dark blue.
Configuring the Progress Status Report
Users can specify and configure the report to suit their needs, as with most Safran reports that are not in fixed formats. You can set date range or span, select progress from last or any previous cut-off date, select periodic interval, select to organize the report by start date or finish date, select color codes, and specify font size, column width, and the header date display format.
Set Report Span
You can use the From date and Until date to make the report fit within the date range you want to visualize and display. This allows you to look at a narrower time range than the entire project span. Your focus and interest will often be on a limited period.
Specify Column Interval
Each column in the report represents a period. You can specify the intervals by selecting them from the drop-down list. Periods available are Days, Weeks, Project Months, Calendar Months, Quarters, and Years. You can also specify the number of periods per column.
Progress From
The progress from option allows you to view the report according to progress by the last period or by any previous cut-off periods.
Plan
You can use the drop-down list to select dates used to be from the Baseline plan, the Live plan, or the Revised plan.
Select Dates
The report is organized by periods. By selecting early or late dates, you specify which date determines the placement of the activity. If you use the start date, the activities will be put into the periodic column by the start date. If you select the finish date, the activity will be put into the columns by their finish date.
Specify Colors
The report comes with a default color scheme of green (completed), yellow (progress above 50%), orange (progress below 50%), and red (not started; Progress=0). The color scheme can be changed by selecting colors from the drop-down list.
Column Layout
Use the layout options to set the column header display format, font size to be used for activity IDs, and the display of the periods/columns.