The Progress Summary Report
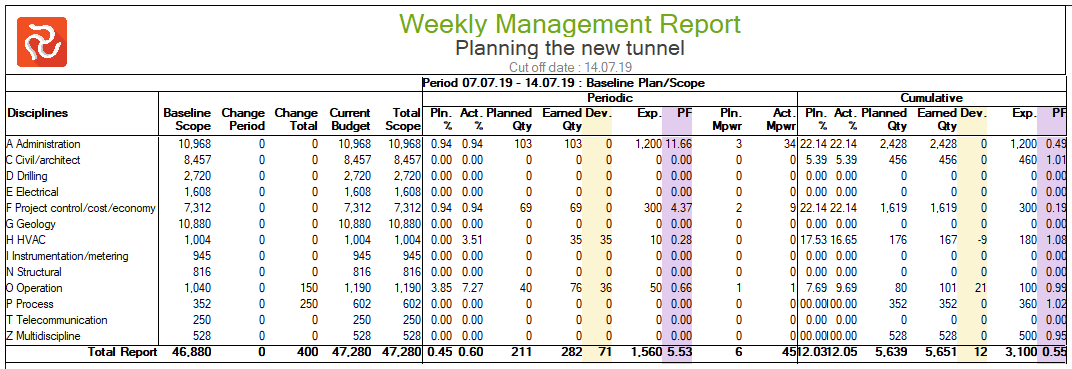
The Progress Summary Report is a project status report based on critical performance measurement and comparison data. You can choose to show cost, quantity, or manhours data, and you can present data at a detailed activity level or summarize for project phases, discipline OBS, WBS, or the entire project. The Progress Summary Report is many organizations' most highly valued status and performance report.
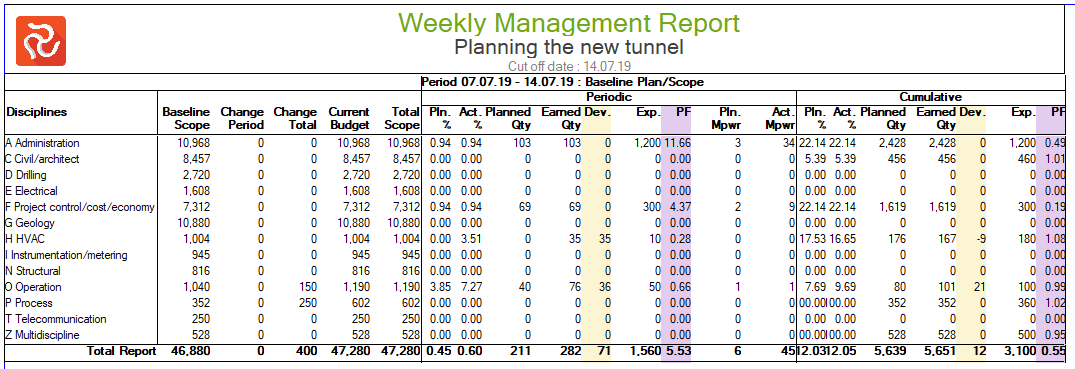
The Progress Summary Report is used for evaluating your project's performance, which is measured and compared on both a periodic and cumulative basis according to units of QTY or Cost. Earned value is calculated by multiplying Percent Complete by the Budget.
Configuring the Progress Summary Report
The Progress Summary Report is feature-rich. The configuration pane uses the standard Safran reports setup—a tab-divided interface with a Titles tab, Filter tab, Report Tab, Fields tab, and a Resources tab. This chapter will discuss the options and features of the two tabs essential to this report, the Report and Field tabs.
The report has five primary column sections: Activity/Summary level, Budgets and Scopes, Periodic values, Cumulative values, and Next-period values. You can choose the information to present within these primary data sections.
To summarize and group data, the Progress Summary report provides five levels of sectioning including total and grand total summaries.
Section header and column background colors may be chosen to enhance clarity and presentation.
Report Tab
The Report tab governs the major characteristics of the Progress Summary report such as reporting period, level of detail, summary levels, schedule and scope basis as well as visual formatting options.
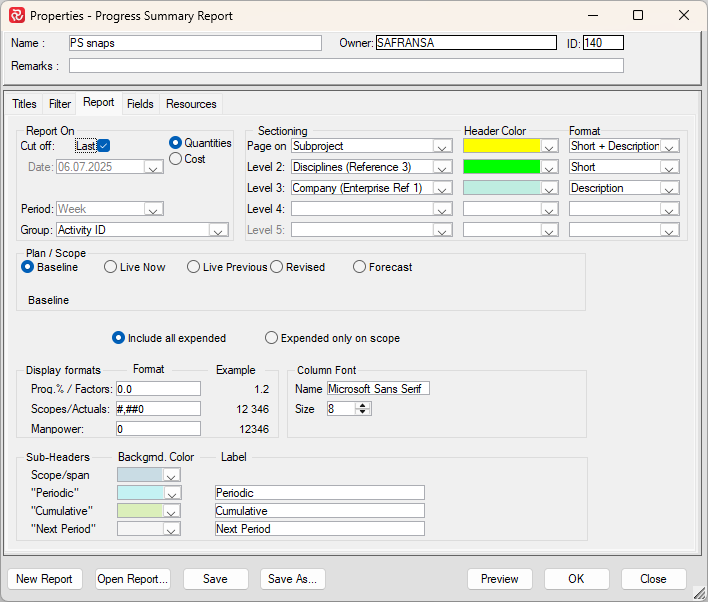
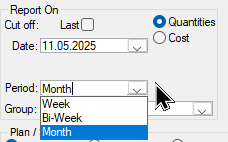
The Report On section allows you to base the report on either QTY or Cost, choose the reporting period and determine the lowest level of information.
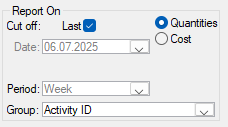
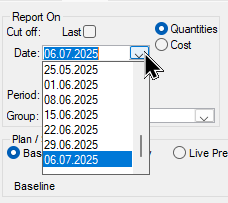
The default value for Cut-off is 'Last' and with a 'Weekly' Period, however if you uncheck 'Last', you’ll notice that you can choose to run the report for any previous cut-off. Further, if the 'Last' or selected previous period is either a ‘Monthly’ or ‘Bi-weekly’ cut-off according to your Project Properties Cut-off dates, you can also choose the period to be either Week, Month, or Bi-week. Month in this context is considered to be Project Month as defined in Project Properties/Cutoff Dates. The same applies to Bi-week.
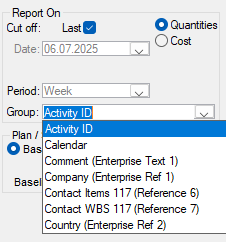
The Group dropdown controls the lowest level of information presented where 'Activity' is the default. You can, however, select any relevant grouping field from the drop-down list (Reference, Outline, Text, Resource, Flag, Project, etc.).
Numeric fields will be then summarized for each different group value.
Controlling Page Shifts and Sectioning
The Sectioning functions allow you to group your selected group/lowest level of information in 4 aggregated levels in addition to a 'Page' level.
Page shifts are controlled by the level 1 sectioning field. Safran Project sorts the report based on the values in the field and does a page throw for each new value in the field. Summaries will be presented for all numeric values.
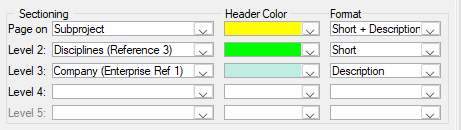
You can choose a background color for the header and also determine how the value for each level value is presented by selecting Short, Description, or Short + Description for each level from the 'Format' drop-down in order to make your report more legible.
Plan and Scope Considerations
The Plan / Scope section provides a high degree of flexibility as to which Schedule and relevant Scopes to base your report on.
You can choose between the Baseline, Live Now/Previous, Revised, and Forecast schedules. If you choose the Live plan options, you have more options to select scope: Baseline, Current Total, and User-defined. The user-defined option allows you to choose QTY type (Planned/Contract) and which change item types to include: Original, Approved changes, Estimated changes (i.e., variation order requests, internal changes, and sub-contracted work). The live plan can be viewed as it is now, as it was at the previous, or at the selected cut-off.

The default setup, which is most commonly used, is based on the Baseline schedule (Baseline Early Start/Early Finish) and Baseline scope (CSH). Note that when choosing the Baseline schedule the corresponding scope is always the Baseline scope in order to assure consistency with other status reports (Gantt and Histogram & S-curve).
You can choose other Schedules and relevant Scope combinations as a point of reference providing increased insight in specific aspects of project performance.
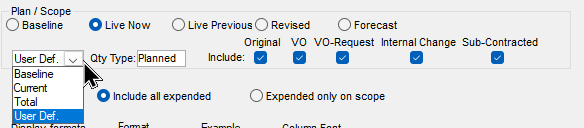
The Live Now option uses the Live schedule (Early Start/Early Finish) as it currently is (or was at the time if you choose an earlier Cut-off). You can choose between Baseline/Current/Total scope (CSH/RSH/TSH) as well as Used Defined scope. This option gives you a highly ‘up to date’ picture of the work going on in the project and is of major importance between Baseline updates when schedule/scope dynamics are at their most intensive. Choosing User defined for Scope allows you to choose specific scope elements or change types to base the report on.
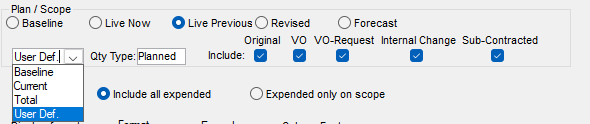
The Live Previous option works in very much the same way as Live Now, however ‘Live’ in this case, in stead of using the ‘current’ Live schedule, uses the ‘previous’ Live schedule and selected scope as it was saved during the Status update prior to the current Cut-off. This concept also applies if you uncheck 'Last' and select an earlier cut-off.
‘Previous’ in this context will also depend upon the Period duration selected. If Week is selected Live Previous will be the previous week as described above. However if Month/Bi-week is selected Live Previous will be the previous Month/Bi-week cut-off.
The Revised and Forecast plan options require that the relevant processes have been executed and are fairly self-explanatory.
If you choose the Revised option the report will use the Revised schedule (Revised ES/EF) and allow you to choose between the Revised/Current scope as defined in Project Properties/Scope.
.png)
Choosing Forecast will use the Forecast schedule (Forecast ES/EF) and the Forecast scope as configured when running the Forecast process.
.png)
All Plan/Scope configurations allow you to choose between including Expended values from all resources or only the Expended values from the specific scope you have selected.
If you choose to present cost data and have set up the project to use complex rates as a cost item, a section allows you to include any or all of the overhead, COM, or indirect G&A.

Configuring visual aspects of the report
The lower section of the Report tab allows you to configure additional visual aspects of your report such as Display formats, Column Font/Size, and Sub-header background color and Label for the four primary columns of the report.
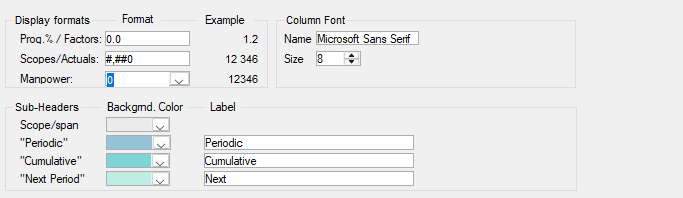
To change a default numeric Display format, click in the Format box and choose from the pre-defined formats.
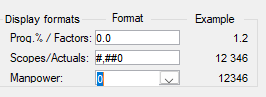

The Example column is then updated reflecting your choice.
Fields Tab - Selecting Report Columns
Using the Fields pane, you can select columns for the primary columns: Group, Totals (scopes), Periodic values, Cumulative values, and Next period values. The total number of columns available and their default column size are wider than would fit across a single page. As you select or de-select columns, the remaining space is displayed at the bottom of the pane. Type a lower number in the size field to reduce the column size.
Fields are selected by marking the’ Include’ checkbox. You can specify user-defined column headers and column size and select a column background color.
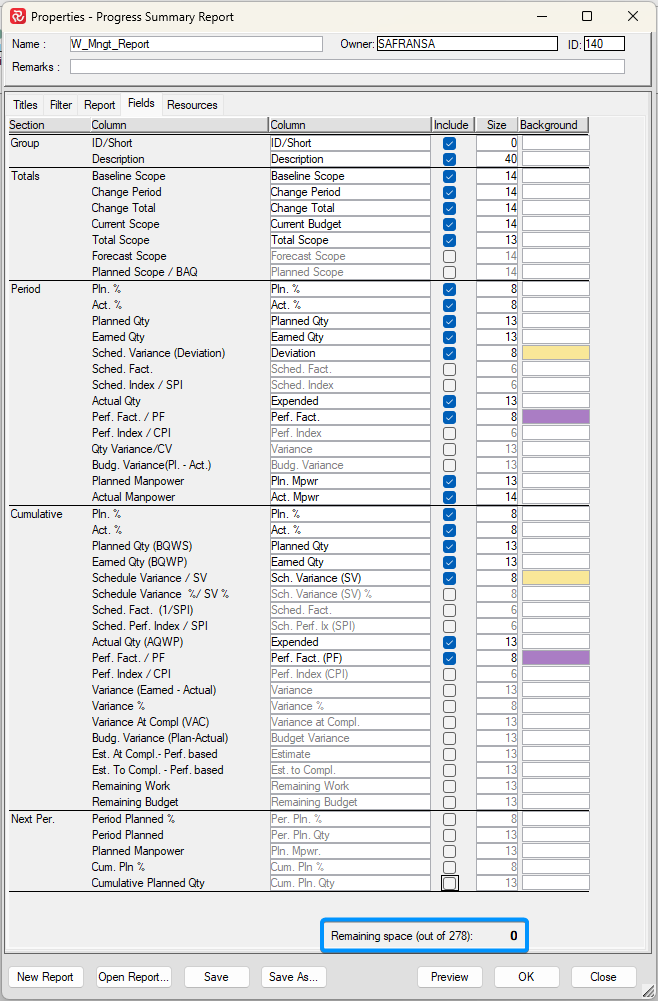
Note the 'Remaining space' counter at the bottom of the screen that helps you determine the remaining cross-page space while configuring your report.
Saving the Progress Summary Report to Excel
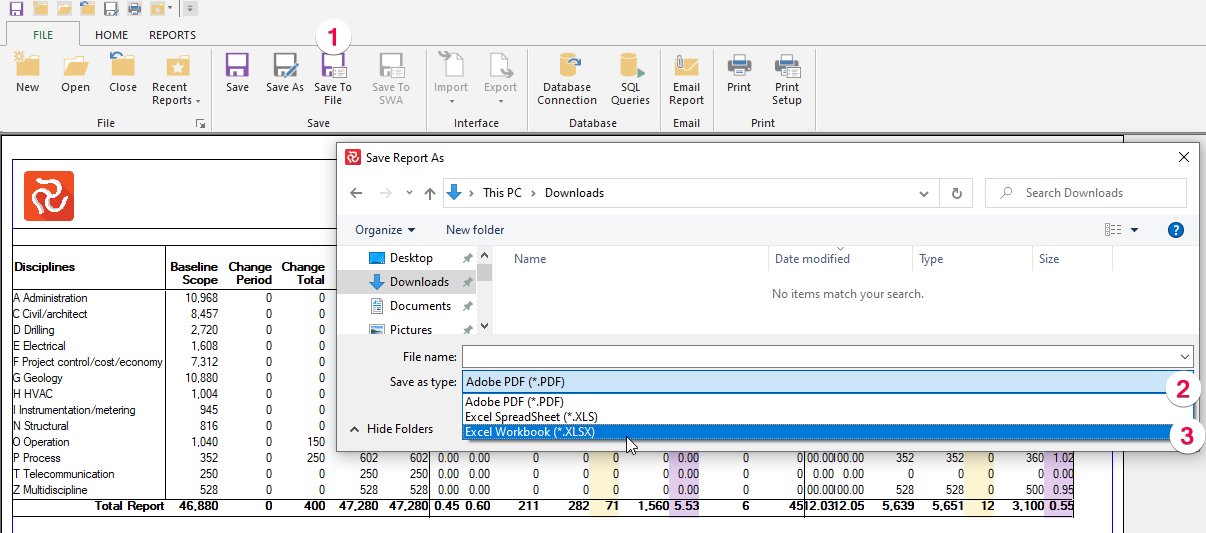
The content of the Progress Summary report may be saved to an Excel file format using the 'File/Save to file' function and selecting one of the Excel file types from the 'Save as type' dropdown when in preview.
Follow these steps to customize your Progress summary report:
- Select the current reporting period. The default report period is the last cutoff, but you may select a previous cut-off to produce a report with historical data.
- Select to report on Cost or Work (Qty). The default is Work. If you choose to report on cost, your cost overhead selection line is included in the report pane.
- Specify the reporting period for periodic values. The default is week; this may, however, be set to a month to produce monthly progress summary reports. This will also be an option if you have defined bi-weekly reporting periods.
- Specify report grouping. By task or by any custom code—for example, by department. This will then produce one line per department. The default is by Activity, which has one line per Activity ID.
- Select scope. The progress summary report calculates performance figures. These can be weighed against your Baseline plan or current work.
- If Cost is selected and your project contains Complex Rates, you can mark the appropriate Cost indirect to be included. The default is none.
- Specify report page sectioning and page break. Sectioning can be specified for any custom field or outline code. You are allowed to set five levels of report sectioning.
- Specify column display formats, column font, and column size.
- Specify the background color for the sub-section heading. You can also input your labels.
Field & Metric Explanations for the Progress Summary Report
The following is a detailed explanation of the various fields of the Progress Summary Report, including the math behind each field.
| Field | Description | Formula | |
|---|---|---|---|
| Group | ID/Short | Activity ID or short code for the selected 'Group On' level | |
| Group | Description | Description for the selected 'Group On' level | |
| Total | Baseline Scope | Baseline scope as it would have been if it was updated at last Status Update | Sum from period_status_r marked by csh flag |
| Total | Change Period | Change of scope in the reporting period | (Current scope-Baseline scope)-(Current scope previous-Baseline scope previous) |
| Total | Change Total | Cumulative change of scope | Current Scope-Baseline scope |
| Total | Current Scope | Current Scope | Sum from period_status_r marked by rsh flag in database |
| Total | Total Scope | Total Scope | Sum from period_status_r marked by tsh flag in database |
| Total | Forecast Scope | Forecast Scope | |
| Total | Planned Scope / BAQ | What the selected scope actually is. (If this doesn't match the selected scope, there probably have been some changes on resources which are not a part of the Change Register (Lock Scope is or has been switched off)) | Result of the aggregation of the selected plan/scope |
| Periodic | Pln. % | Planned percent | |
| Periodic | Act. % | Calculated Actual percent | (Earned Qty / Selected Scope)*100 |
| Periodic | Planned Qty | Planned Qty | |
| Periodic | Earned Qty | Earned Qty | (Actual%*Planned Qty)*100 |
| Periodic | Sched. Variance (Deviation) | The deviation between Earned and Planned Qty | Earned Qty - Planned Qty |
| Periodic | Sched. Fact. | Schedule factor. 1 = On Schedule. < 1 = Ahead of Schedule. > 1 = Behind Schedule | Planned Qty / Earned Qty |
| Periodic | Sched. Index / SPI | Schedule Performance Index. 1 = On Schedule. < 1 = Behind Schedule. > 1 = Ahead of Schedule | Earned Qty / Planned Qty |
| Periodic | Actual Qty | Reported Expended Qty | |
| Periodic | Perf. Fact. / PF | Performance Factor. 1 = On Budget. < 1 = Under Budget. > 1 = Over Budget | Actual Qty / Earned Qty |
| Periodic | Perf. Index / CPI | Cost Performance Index. 1 = On Budget. < 1 = Over Budget. > 1 = Under Budget | Earned Qty / Actual Qty |
| Periodic | Qty Variance/CV | Variance between earned and expended | Earned Qty - Expended Qty |
| Periodic | Budg. Variance(Pl. - Act.) | Variance between budget and expended | Planned Qty - Expended Qty |
| Periodic | Planned Manpower | Planned Manpower | Planned QTY / Days pr week / Hours pr day |
| Periodic | Actual Manpower | Actual Manpower | Expended QTY / Days pr week / Hours pr day |
| Cumulative | Pln. % | Planned percent | |
| Cumulative | Act. % | Calculated Actual % | (Earned Qty / Selected Scope)*100 |
| Cumulative | Planned Qty (BQWS) | Planned Qty | |
| Cumulative | Earned Qty (BQWP) | Earned Qty | (Actual%*Planned Qty)*100 |
| Cumulative | Schedule Variance / SV | The deviation between Earned and Planned Qty | Earned Qty - Planned Qty |
| Cumulative | Schedule Variance %/ SV% | Schedule Variance in percent of Planned Qty | Schedule Variance / Planned Qty * 100 |
| Cumulative | Sched. Fact. (1/SPI) | Schedule factor. 1 = On Schedule. < 1 = Ahead of Schedule. > 1 = Behind Schedule | Planned Qty / Earned Qty |
| Cumulative | Sched. Index / SPI | Schedule Performance Index. 1 = On Schedule. < 1 = Behind Schedule. > 1 = Ahead of Schedule | Earned Qty / Planned Qty |
| Cumulative | Actual Qty (AQWP) | Reported Expended Qty | |
| Cumulative | Perf. Fact. / PF | Performance Factor. 1 = On Budget. < 1 = Under Budget. > 1 = Over Budget | Actual Qty / Earned Qty |
| Cumulative | Perf. Index / CPI | Cost Performance Index. 1 = On Budget. < 1 = Over Budget. > 1 = Under Budget | Earned Qty / Actual Qty |
| Cumulative | Variance (Earned - Actual) | Variance between earned and expended | Earned Qty - Expended Qty |
| Cumulative | Variance % | Variance in percentage of earned | (Variance/Earned)*100 |
| Cumulative | Variance At Compl (VAC) | Variance at completion Negative result = over budget. Positive Result = Under Budget | Budget at Completion (BAC) - Estimate at Completion (EAC) |
| Cumulative | Budg. Variance(Plan-Actual) | Budget variance | Planned Qty - Expended Qty |
| Cumulative | Est. At Compl. - Perf. Based | Expended Qty plus Estimate to Complete | Expended Qty + Est. To Compl. - Perf.Based |
| Cumulative | Est. To Compl. - Perf.Based | Estimated Qty to complete | Remaining Work / CPI |
| Cumulative | Remaining Work | Planned Scope - Earned Qty | |
| Cumulative | Remaining Budget | Baseline Scope - Expended Qty | |
| Cumulative | Period Planned % | Period Planned Progress until next Cut-Off Date | |
| Cumulative | Period Planned | Period Planned Qty until next Cut-Off Date | |
| Cumulative | Planned Manpower | Period Planned Manpower until next Cut-Off Date | Period Planned / Days pr week / Hours pr day |
To learn more about the various scopes (Baseline, Current, and Total scope), see the chapter on Scope.
https://docs.safran.com/docs/safran-project-setting-up-projects#scope