Schedule Health Assessment
The Schedule Health report is a project metric analysis tool that provides detailed insight into schedule quality and key project performance metrics. Understanding the content and quality of a schedule is often difficult unless you develop the schedule yourself. You can use the schedule health report to give you a quick overview of the characteristics of a Contractor's submitted schedule and further help you assess its integrity and credibility.
The Safran Schedule Health Report assists you in evaluating the quality of the schedule, providing critical metrics such as the number of tasks missing logic, total, incomplete activities, activities with constraints, activities with long durations, urgent tasks, float, link type information, and more.
Your schedule, and your baseline in particular, reflects the agreed-to implementation of your plan at the beginning of the project or after a significant re-planning during the lifecycle of the project. It provides the basis required for sound schedule control and sets the benchmark against which the project's progress is measured.
Suppose the baseline, or more generally, the schedule or plan at any stage is crucial to project success. In that case, it makes sense to do everything necessary to ensure its accuracy according to standards and recommendations are maintained correctly.
The Schedule Health Report provides summary listings together with credibility and performance indicators. For the execution phase of your project, the Schedule Health Report provides Baseline Execution Indices, Performance Indices, and Completion Ratio. The Schedule Health report supports both the '14-point schedule' metrics and the 'Tripwire' metrics.
One significant benefit of running a schedule health report and performing a schedule health assessment is that more people are likely to engage in the work associated with establishing a credible schedule.
Does Your Schedule Pass the Test?
The objective of any schedule assessment is to provide a set of tools and indicators for determining your schedule’s completeness and practicality, whether it's your baseline schedule or any later update. You will probably agree that if your schedule is essential to project success and to sound project schedule and control, then it makes sense to do everything you can to ensure it is accurate and maintained correctly. Because if it’s not, then your schedule:
- May not reflect the total scope of work.
- May not provide sound project logic.
- May reflect an inaccurate or incomplete status.
- May reflect an inaccurate model of planned implementation.
- May not provide Critical Path identification or float for all activities or milestones.
- May provide an incorrect basis for resource planning.
- May not provide for ‘What-If’ analysis.
A schedule assessment is essential because the schedule may not reflect an accurate and truthful picture. The plan and status may be inaccurate, or the scheduling process may be flawed.
Running a schedule health check is particular important the more planners that are involved with updating the schedule.
Credibility Indicators
The key components of your schedule are a critical path method (CPM) tool, sound project logic, work calendars, and resource requirements. Sound project logic should provide the basis of all project schedule data. It is a model that reflects the planned project implementation and sequencing using activities and milestones, interdependencies, durations, and date constraints.
Scope of Work
Your schedule should reflect all activities, the total scope of work, and all WBS elements. If not, it can indicate that the project, the schedule, or both are poorly defined. Later in the project, it can also indicate a lag in implementing changes. An inaccurate model of the planned work provides an incorrect basis for resource planning. Many modifications to the scope of work (count and work) may also indicate that the project is poorly defined.
Missing Logic - Dangling Activities
All activities and milestones should have interdependencies assigned. Exceptions are project start and completion and external deliveries. Missing logic should be identified as it may impact your schedule.
- Activities with no successors may slip with no resulting visible impacts.
- Activities with no predecessors may incorrectly reflect start dates that are too early or start dates that are not realistic.
- Hampers accurate critical path identification.
- Hampers reliable “what-if” analysis.
- Hampers reliable alternative analysis.
- Hampers credible free float and total float calculations.
Relationship Types
Project logic should be predominantly Finish-to-Start (FS) relationships.
The FS relationship type (once the predecessor is finished, the successor can start) provides a logical path through the project. The Start-to-Finish relationship is non-intuitive (the successor cannot complete until its predecessor is started) and should only be used rarely.
See also Appendix A.
Delays
The size and frequency of delays should be minimized. Delays (positive or negative) can manipulate float or constrain the schedule. The critical path, project duration, total and free float, and schedule analysis can be affected negatively using delays.
Number of Constraint Dates
Ideally, minimal use of date constraints is strongly recommended. Constraints prohibit accurate calculations for total project critical path identification and analysis, wrong free float and total float values, and potentially incorrect activity start and finish dates.
will prevent activities from being moved by their dependencies, preventing the schedule from being logic-driven.
- Start No Earlier Than
- Finish No Earlier Than
- Start No Later Than
- Finish No Later Than
- Must Start On
- Must Finish On
- As Late As Possible
Safran allows an activity to have more than one constraint date. To identify if your schedule contains any activities with more than one date constraint, you may run the XER Export Check.
High Float
An activity with high float may result from wrong or missing logic. If the number of activities with high float is excessive, this may indicate that the project is unstable or not logic-driven. On the other hand, if the logic is sound, a path with a high float may suggest that extra work can be added to accelerate work, given that the resources to complete the work are available during this period.
Negative float
Activities with negative float should have an explanation and a corrective action plan. Ideally, there should not be any negative float in the schedule.
High Duration
The schedule should realistically reflect how long each activity would take to execute. These durations should be as short as possible. They should be manageable, meaning you can measure progress against it. Activities with long durations may be broken down into more discrete activities rather than one activity. This helps to make activities more manageable, which provides better insight into work and schedule.
Assigning Resources to All Activities
The schedule should reflect what resources are needed to complete the work. Resource requirements should align with availability to represent a feasible schedule.
Inaccurate and Improperly Scheduled Activities
You should avoid assigning actual start/finish dates later than the cut-off dates to activities scheduled to occur in the future. Another critical aspect is ensuring the cut-off date is current and not too far in the past to be meaningful. Out-of-date data is just another way of saying it is inaccurate. You should also watch out for out of sequence updates.
Maintaining the integrity of the schedule and its logic is not only necessary to reflect actual status, but is also required to foster confidence in the schedule.
Major Project Milestone Tracking
Slips in early key project milestones typically lead to slips in key milestones later in the project. Your project should contain end-to-end project logic, including your project milestones, and the activities and milestones should be sequenced in the order they take place. If slippage in early project milestones does not have a knock-on effect and impacts later crucial milestones, it could be caused by incomplete logic.
Testing Your Schedule
What test or evaluation work should you do besides running a schedule health assessment report? Safran's Schedule Health Report helps you collect and summarize various indicators and items of information concerning your schedule. In addition, you should carefully examine your schedule using Safran reports such as the Barchart Editor, The Histogram/S-Curve reports, and the Performance charts. The Barchart Editor should be used to check the critical path—the longest duration path through the sequenced list of activities.
You can use the Safran Project histograms to evaluate manpower requirements for the total project by phase, area, section, block, floor, or any group or sub-group of interest. You can use S-curves and spread curves to evaluate planned productivity. Spread curves can be used to assess a project's phasing or evaluate, for example, the planned productivity by trade in different modules, sections, floors, and more. Use the Safran reporting facility to ensure all WBS have resources, work, or costs assigned to them.
Schedule Health Report basics
The Schedule Health Report uses metrics that have been found to meet the criteria for Schedule Health Assessment. It is a framework for improving your project schedule. You can run the report as part of your self-analysis before the schedule is discussed and critiqued by any other project stakeholder.
The Schedule Health Report may be found in the Tabular section of the Reports ribbon as shown below:

Numerous initiatives, papers, and discussions regarding improving CPM schedules have appeared in recent years. Two are the DCMA's (US Defense Contract Management Agency) 14-point Assessment and the Tripwire on scheduling. The focus of these initiatives is on validating the structural integrity of a schedule.
The Safran Schedule Health Report provides the necessary metrics and standard configurations for both the 14-point Assessment and the Tripwire initiatives.
The two standard report configurations may be chosen from the 'Include Fields as' section on the 'Report' tab as shown below:

14 Point Assessment report
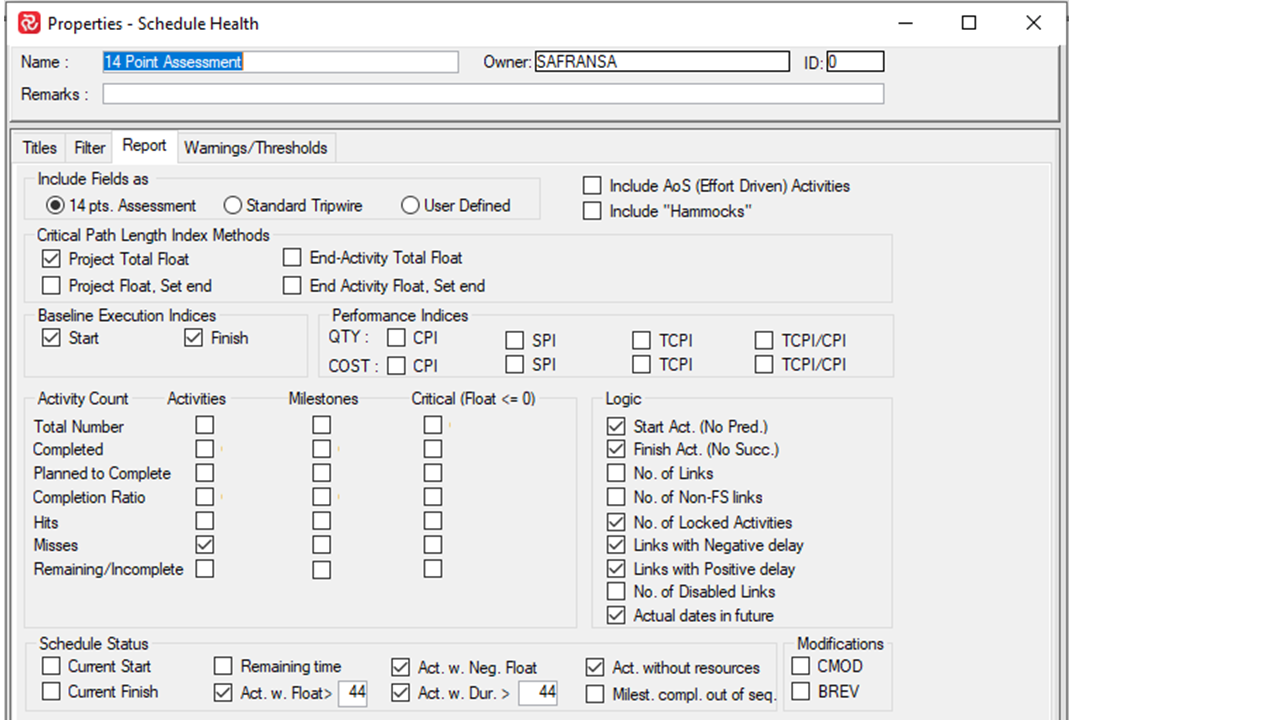
The standard metrics for the 14 Point Assessment are shown above. Once you choose the "14pts. Assessment" radio button, the report makes an automatic selection of metrics which are non re-configurable.

By default AOS (Always on Schedule/Effort Driven) activities and Hammocks are not included. However you may have them included by checking the relevant box in the 'Include Fields as' section as shown above.
Standard Tripwire report
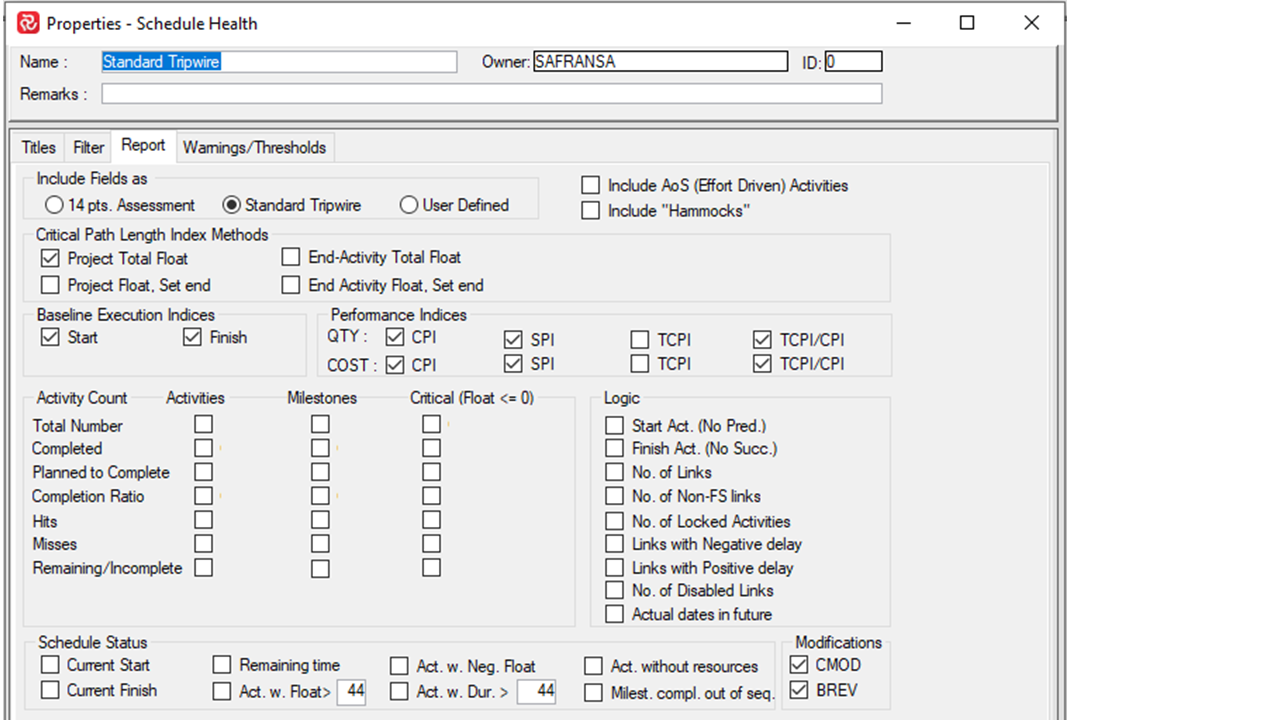
The standard metrics for the Standard Tripwire are shown above. Once you choose the "Standard Tripwire" radio button, the report makes an automatic selection of metrics which are non re-configurable.
By default AOS (Always on Schedule/Effort Driven) activities and Hammocks are not included. However you may have them included by checking the relevant box in the 'Include Fields as' section as shown above.
User Defined Schedule Health report
In addition to the standard reports shown above, you can also select and store a user defined configuration containing any number of the wide range of available schedule/performance metrics by selecting the 'User Defined' radio button in the 'Include Fields' section of the report configuration panel.
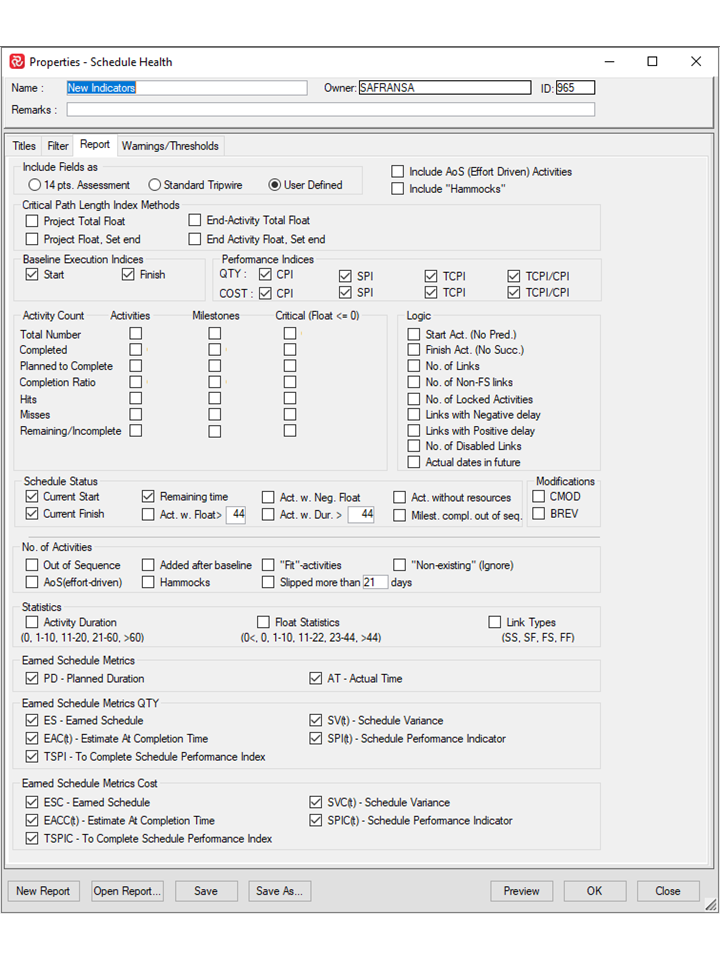
If you wish to modify e.g. the "14pts. Assessment" report, the easiest way to do that is to
- Choose radio button "14 pts. Assesment
- Choose radio button "User Defined"
- Then add or remove metrics to your preference
The User Defined Report will remember the selection from either 14 pts. Assessment or Standard Tripwire.
By default AOS (Always on Schedule/Effort Driven) activities and Hammocks are not included. However you may have them included by checking the relevant box in the 'Include Fields as' section as shown above.
Filtering capabilities
All three types of Schedule Health Reports may be filtered by using standard Safran filtering capabilities in order to 'zoom' in on a specific subset of activities in your schedule.
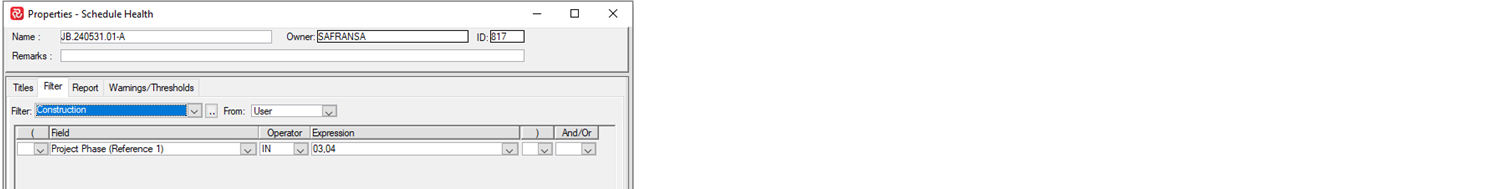
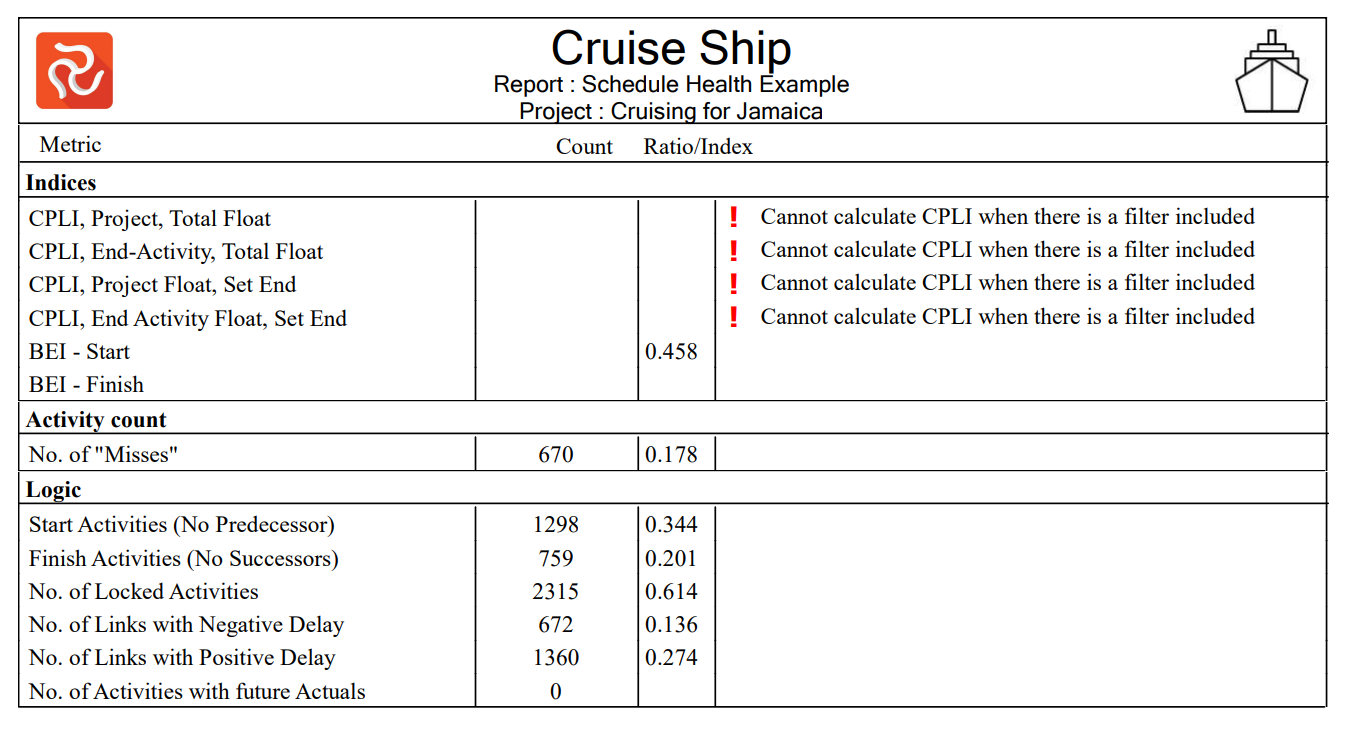
Please be aware that when a filter is applied to a Schedule Health report, it may have unintentional effects on certain calculations.
This can happen when linked activities are 'removed' by a filter which in turn disturbs the logical integrity of the network/remaining activities. This may in some cases have an effect on float calculations although other calculations may be also affected.
Please therefore 'think twice' when using a filter for this report.
When a filter is applied the Critical Path Length Index (CPLI) can no longer be calculated. In this case a warning will be provided for each CPLI selected as shown below:
Defining Thresholds and Warnings
In addition to presenting the various metric and check values, the Schedule Health Report also allows you to present warnings when a certain threshold is met or exceeded in order to draw attention to undesirable schedule/performance conditions.
The conditions available for warnings are related to the Critical Path Length, Baseline Execution, and QTY based Cost/Schedule/To Complete Performance index and may be found on the 'Warnings/Thresholds' tab of the configuration panel as shown below:
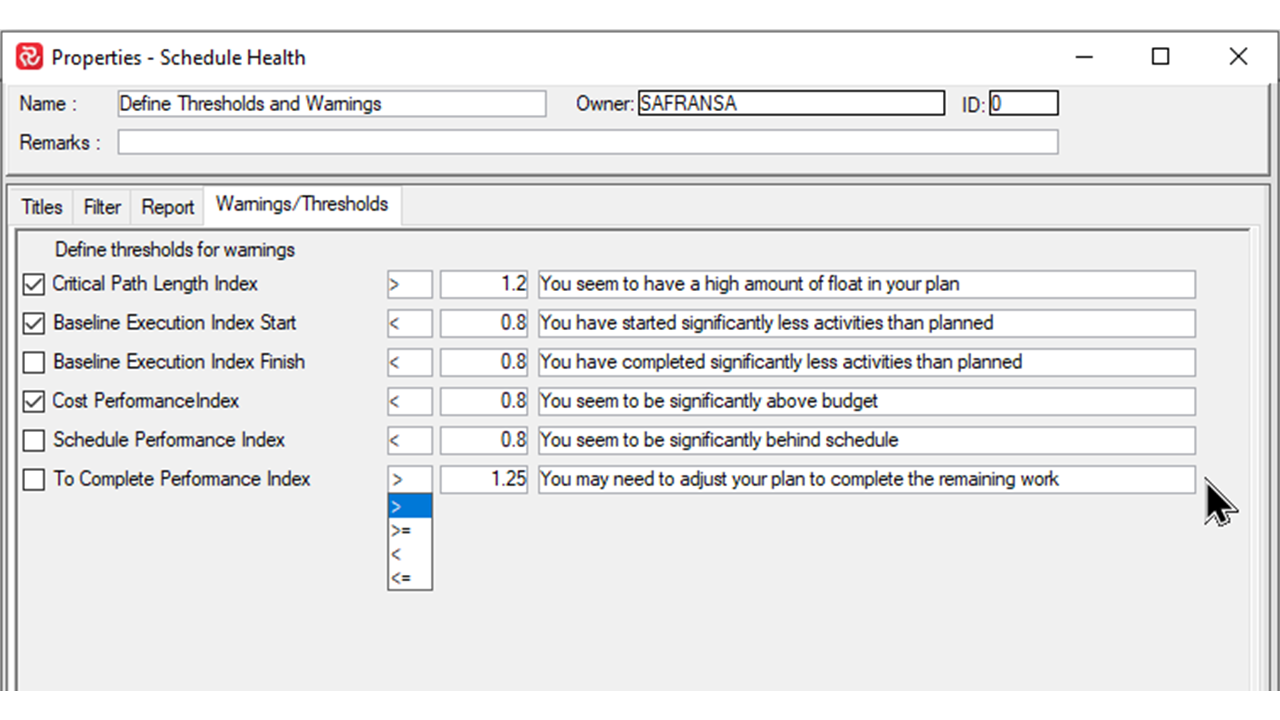
Use the checkbox to the left to select a warning. Each warning may be configured to occur for values 'greater/less' or 'greater=/less=' a certain value by selecting the relevant argument from the DD list box.
Default threshold values are presented however you may change these according to your own requirements.
You may also modify the default warning text to suit your own needs if required.
Viewing your report & saving a configuration
While selecting relevant metrics and checks, you can press the 'Preview' to to have a look at your configurated report.
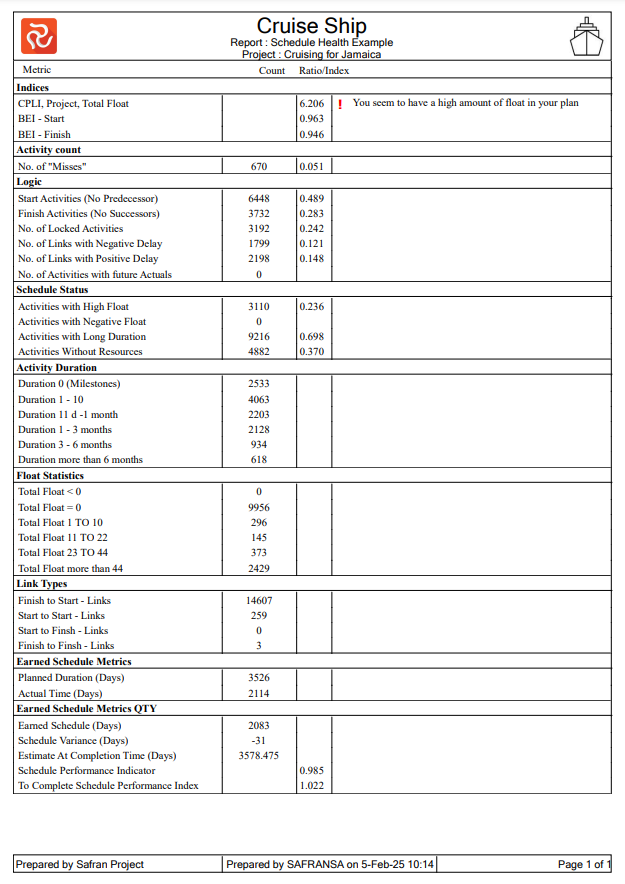
When you are satisfied with your report, you can give it a Name and press 'Save' to save the configuration.
Schedule Health report metrics
The majority of the metric checks focus on the planning phase of your project. However, a number of metrics (baseline execution index, CPI, SPI, TCPI, Hits, Invalid dates, etc.) focus on project performance and status during execution. The following section reviews the various metrics, indicators, and checks available.
Critical Path Length Index Methods
The Critical Path Length Index (CPLI) is a metric used to measure the relative efficiency to complete a milestone on time. It’s used to calculate and graphically display the Critical Path; the longest series of scheduled activities to complete a project. CPLI is a OSD(A&S) tripwire metric.
CPLI = (Critical Path Length +/- Total Float ) / Critical Path Length
A Critical Path Length Index of:
Less than 1 = the program will not achieve its baseline completion date without corrective action and the CPLI should be tracked to gauge the realism of completing the contract on time.
Greater than 1 = the program schedule is running efficiently in relationship to the milestone
Equal to 1 = desired efficiency ratio
Critical Path Length Index (CPLI) Example:
Through April the supplier network schedule calculates a program critical path length of 720 workdays (3 years) with 60 workdays (3 months) of negative float from contract award to completion:
CPLI = [( 720 – 60) / 720] = 0.917
At present, the CPLI of less than 1.00 indicates that the program will not achieve its baseline completion date without corrective action and the CPLI should be tracked to gauge the realism of completing the contract on time.
Given that companies define projects and schedules differently when using the available project length, we have implemented four options to set the default finish for this calculation as shown below:
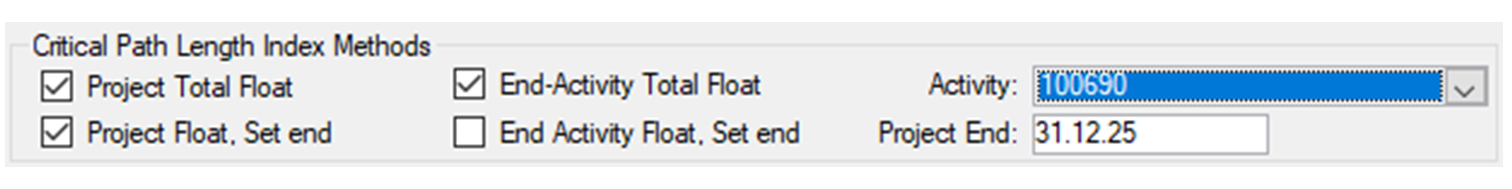
- Project Total Float - Default
- Project Total Float, Set End - a date may be specified to be used as the end date for the project and used for the CPLI calculation
- End Activity Total Float - if multiple finish activities exist a specific activity/milestone may be selected as the end point for Total Float/CPLI calculation
- End Activty Float, Set End - If an End activity is selected an End date may also be specified as the end point for Total Float/CPLI calculation
Tip: A threshold/warning may be shown for this index.
See also
Appendix A
Float Trend Analysis Report
Baseline Execution Indices

- Start - No. of activities where Current Actual Start is present/No. of activities where Baseline Early Start <= Cut-off-date.
- Finish No. of activities where Current Actual Finish is present/No. of activities where Baseline Early Finish <= Cut-off-date.
BEI=1 is optimal, BEI>1 is good, BEI<1 is poor.
Tip: A threshold/warning may be shown for this index.
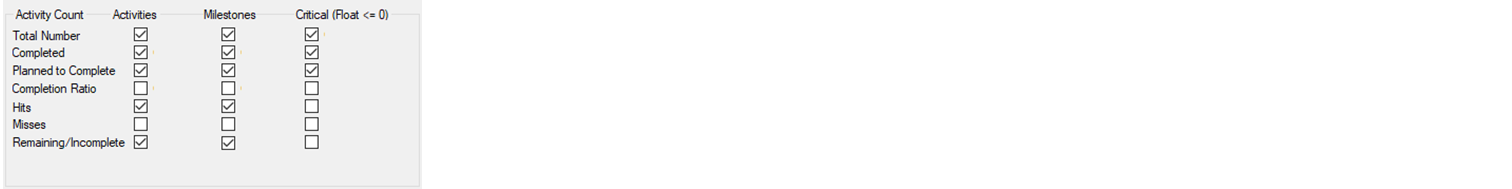
Activity Count
-
Total Number - number of activities and milestones are part of the plan and, in addition, how many of these are critical (Float<=0).
-
Completed - number of activities and milestones are completed (Actual %=100).
-
Planned to Complete - number of activities and milestones that are scheduled to be finished at current cut-off (Baseline Planned Progress=100).
-
Completion Ratio - is calculated based on the formula Completed/Planned to complete (No. of Actual %=100/No. of Baseline Planned %=100).
-
Hits - number of activities and milestones finished before or on the baseline finish date. (Current Actual Finish<=Baseline Early Finish)
-
Misses - number of activities and milestones that have finished later than the baseline finish date. (Current Actual Finish>Baseline Early Finish)
-
Remaining/Incomplete - number of activities and milestones that are not finished. (Actual %<100)
Logic Indicators
The logic checks provide the total number of dangling activities or activities that are missing logic. These checks also summarize the number of activities with targets, the total number of links and non-Finish-Start links, invalid future dates (actual dates in the future), and the number of links with positive and negative delays. Delays are used to delay or accelerate the sequence of activities and can be a risk. They are often used to adjust the CPM dates to fit a target delivery date, and when used to represent actual delay between two tasks, they may become difficult to manage.
A project with missing or incomplete logic and usage of targets may not show the effect of delays in one area throughout your project schedule. This may have implications, such as an overly optimistic schedule. Project completion dates in a schedule are driven by two factors: activity duration and logic. The logic checks do not unmask wrong sequencing (you cannot build the walls before you lay the foundation) but focus on the summary of how structured the schedule is. A project schedule with missing or incomplete logic may give you incorrect completion dates driven by the critical path analyses. Negative delays should be minimal.
By adding the link types check to your assessment, Safran also summarizes the statistics of links by type (Start-Start, Start-Finish, Finish-Start, and Finish-Finish). Use this indicator to validate different link types. Your project logic should be predominantly Finish-Start relationships (above 75%).
Constraints or targets are dates applied to an activity that override dates computed by your project logic. Extensive use of target dates may lock your schedule projects, as they go against the essence of CPM scheduling. There are instances where constraints or targets can address an open end within a schedule. Many users and schedulers use milestones to represent these start or finish points.
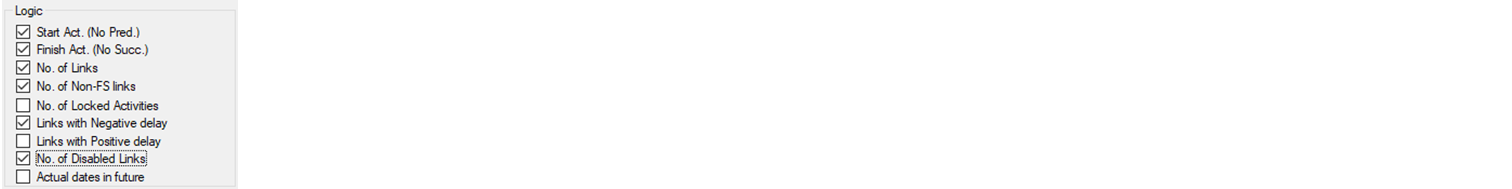
- Start Act. - No. of activities without a predecessor
- Finish Act. - No. of activities without a successor
- No. of links - Total No. of links
- No. of Non-FS links - Total No. of Non Finish to Start Links
- Links with Negative delay - No. of links with Total Float <0
- Links with Positive delay - No. of links with Total Float >0
- No. of Disabled Links - No. of links where Enabled=No
- Actual dates in future - No. of activities where Current Actual Start/Current Actual Finish > Cut-off Date
Execution Phase Indicators
Execution indexes reveal information on how well you are performing according to plan. The Schedule and Cost performance indexes and the To Complete performance indexes should be familiar to most planners. The Baseline Execution index computes the number of activities started/finished on or before its baseline start/finish at the latest cut-off. Why do you need both baseline indexes? You may be a good starter but are so good at finishing your work. Looking at both indicators may give you an insight into different possible problems.
During the execution phase, you can also compute remaining project time, display the current start and finish, and count the number of activities and milestones progressed and completed out of sequence, completed, remaining/planned, and the number of activities and milestones hit and missed activities. A missed activity is an activity that should already be completed and has a missing actual finish or an actual finish date after the baseline finish date.
Since quantities and cost often have different distributions, which will in turn result in different performance figures, you have the ability to choose between qty/cost as the basis for your Performance Indices in order to get the 'total picture' and a better basis for taking necessary decisions and corrective actions.
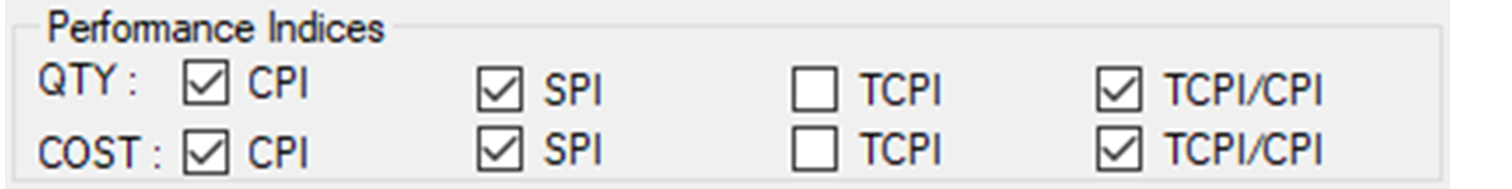
Performance Indices
QTY
- CPI - Cost Performance Index - Expended QTY/Baseline Planned QTY - <1 is poor, 1 is optimal, >1 is good
- SPI - Schedule Performance Index - Earned QTY/Baseline Planned QTY - <1 is poor, 1 is optimal, >1 is good
- TCPI - To Complete Performance Index - Cost Performance Index required on remaining work to meet Budget at Completion (BAC) - Baseline QTY – Earned QTY/Baseline QTY – Expended QTY - <1 is good, 1 is optimal, >1 is poor
- TCPI/CPI - Comparison of current performance to performance required for remaining work - <1 is good, 1 is optimal, >1 is poor
COST
- CPI - Cost Performance Index - Expended Total Cost/Baseline Planned Total Cost - <1 is poor, 1 is optimal, >1 is good
- SPI - Schedule Performance Index - Earned Total Cost/Baseline Planned Total Cost - <1 is poor, 1 is optimal, >1 is good
- TCPI - To Complete Performance Index - Cost Performance Index required on remaining work to meet Budget at Completion (BAC) - Baseline Total Cost – Earned Total Cost/Baseline Total Cost – Expended Total Cost - <1 is good, 1 is optimal, >1 is poor
- TCPI/CPI - Comparison of current performance to performance required for remaining work - <1 is good, 1 is optimal, >1 is poor
Tip: A threshold/warning may be shown for this index.
Schedule Status
Schedule checks for high duration, high float, and negative float allow for schedule improvements. The high float may indicate that logic relationships are potentially incorrect. However, high float can also suggest that the amount of work in a path is small. If so, can you use this float to add work, accelerating the schedule without impacting the critical path? The amount of negative float or activities with low float indicates a tight and critical schedule.
The duration profile data indicates the level of detail in your schedule. Activity durations should be discrete and measurable.
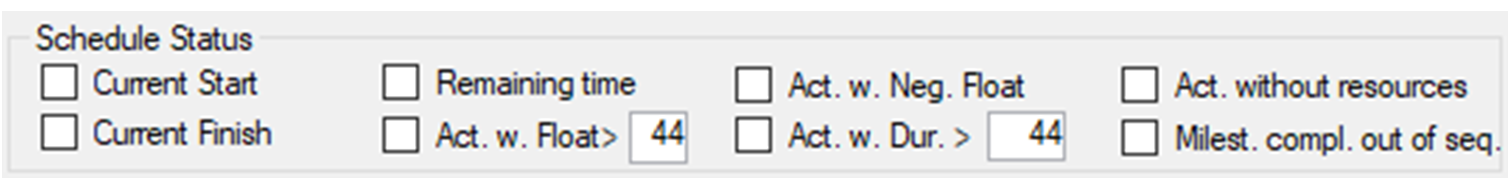
- Current Start/Current Finish - Earliest Current Early Start/Latest Current Early Finish
- Remaining time - Latest Current Early Finish - Cut-off date in days (no calendar)
- Act. w. Float > - No. of activities with Total Float > specified value
- Act. w. Duration > - No. of activities with Duration > specified value
- Milestone compl. out of sequence - No. of milestones where Actual %=100 and one or more preceding activities has Actual %<100
- Act without resources - Activities with no resources
Modifications
Three indicators specifically address the changes to schedule and scope of work. The first is the number of activities added to your schedule since the last baseline, i.e., activities without baseline dates.
Directly related to the contract scope of work are the revision indicators. The Contract Modification Indicator (CMOD) shows the ratio of scope added to your schedule since the first (original) baseline was set. A high CMOD value indicates that the scope of work is not well defined or well defined at the time of project start.
The Baseline Revision Indicator (BREV) shows the increase in approved scope since the latest baseline.

- CMOD=Current QTY(RSH)-Original QTY/Original QTY - Ratio of how much Current QTY(RSH) has increased since original baseline.
- BREV=Current QTY(RSH)-Baseline QTY(CSH) - Increase in Current QTY(RSH) since latest Baseline.
No. of Activities

- Out of Sequence - Activities with Actual%>0 and one or more predecessors Actual%<100
- Aos (Effort Driven) -
- Hammocks - Activities where Activity Type=Hammock
- Added after baseline - Activities added after current baseline, Baseline ES/EF=null
- 'Fit' activities - Activities where Schedule Options/Activity Duration Fit is checked
- 'Non-existing' (ignore) - Activities where Schedule Options/Existence Option=Activity Non Existence
- Slipped more than 'N' days - Activities where Current Early Start-Baseline Early Start > 'N' days
Statistics
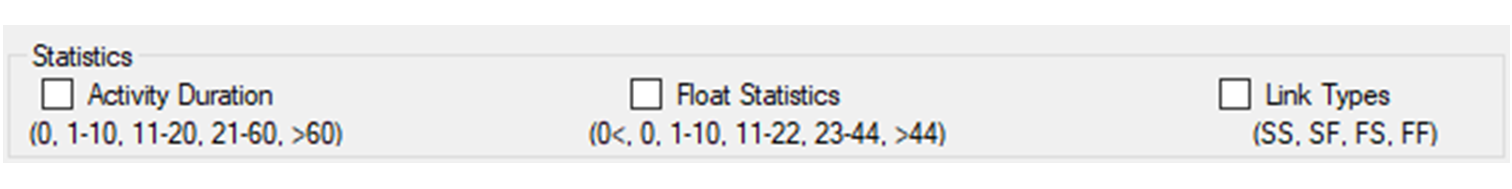
- Activty Duration - Distribution of # of activities per category 0, 1-10, 21-60, >60
- Float Statistics - Distribution of # of activities with float=n per category 0, 1-10, 21-60, >60
- Link Types - Distribution of # of links per category SS, SF, FS, FF
Earned Schedule Metrics
Whereas Performance Indices are based on quantities or costs and expressed as indices, Earned Schedule metrics are based on dates and expressed in durations/time units.
The latter will often give more insight on project performance/completion in the later stages of a project since the Schedule Performance Index tends to go towards 1 while the Schedule Variance approaches 0.
In both cases Project Completion may be far off target but the previous indices would not reflect this state.
To avoid misunderstanding/confusion these metrics are qualified by the (t) indicator.

- PD - Planned Duration - Latest Baseline Early Finish date - Earliest Baseline Early Start date in time units
- AT - Actual Time - Current Cut-off date - Earliest Baseline Early Start date in time units
Earned Schedule Metrics QTY

- ES - Earned Schedule - duration from the Start Date (SD) until the Earned Schedule Date (ESD), expressed in time units
- EAC(t) - Estimate at Completion Time - Estimated Total Project Duration expressed in time units
- SV(t) - Schedule Variance - No. of days behind/ahead of schedule - SV(t)=AT-ES
- SPI(t) - Schedule Performance indicator - SPI(t)=ES/AT – <1 is poor/behind schedule, 1 is optimal/According to schedule, >1 is good/ahead of schedule
- TSPI - To Complete Schedule Performance Index - Schedule performance index required to finish a project in time - EAC(t)-AT/PD-AT - <1 is good, 1 is optimal, >1 is poor
Earned Schedule Metrics Cost

- ESC - Earned Schedule - duration from the Start Date (SD) until the Earned Schedule Date (ESD), expressed in time units
- EACC(t) - Estimate at Completion Time - Estimated Total Project Duration expressed in time units
- SVC(t) - Schedule Variance - No. of days behind/ahead of schedule - SV(t)=AT-ES
- SPIC(t) - Schedule Performance indicator - SPI(t)=ES/AT – <1 is poor/behind schedule, 1 is optimal/According to schedule, >1 is good/ahead of schedule
- TSPIC - To Complete Schedule Performance Index - Schedule performance index required to finish a project in time - EAC(t)-AT/PD-AT - <1 is good, 1 is optimal, >1 is poor