Float Trend Analysis Report
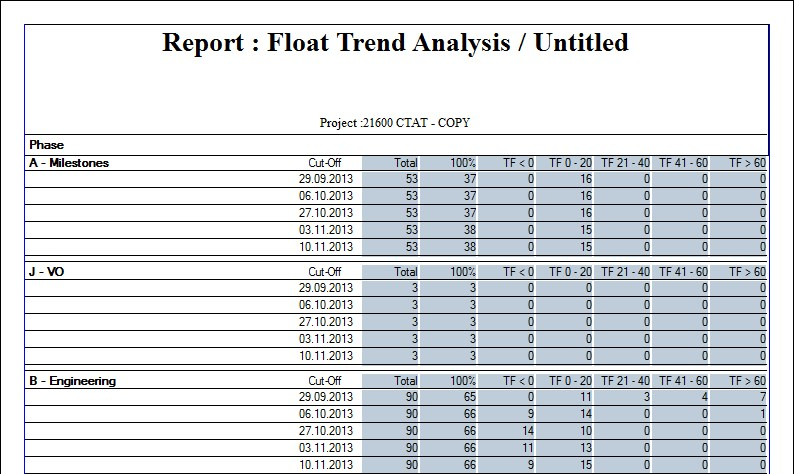
The Float Trend Analysis Report lets you display float information by reporting period, summarized by float value bands counting the number of activities within each band TF=0, TF 0-20, TF 21-40, TF 41-60, and TF >60 days. In addition, the report displays the total number of activities and the total number of activities completed = 100%. Note that the current schedule calculated float is used in this report. You can use this report to see how activities are being completed and how activities move from one float range to another.
Configuring the Report
The report can show values displayed for the entire project or grouped by reference fields. Even more, you can specify reporting periods—each cut-off, Bi-weekly, Project Months, and last cut-off only.
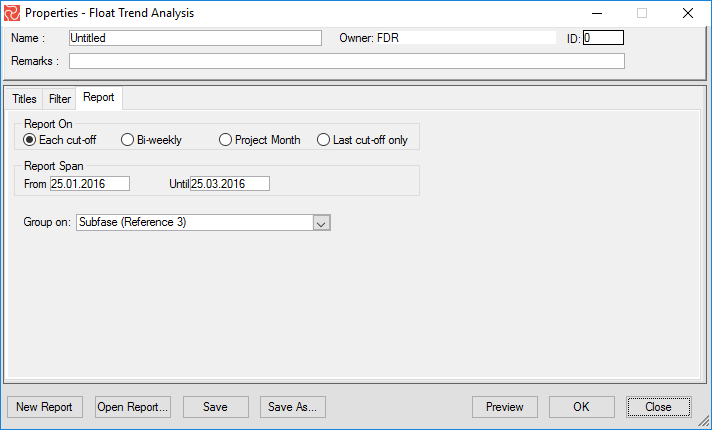
You can also specify the report span. This can narrow down the amount of cut-offs displayed and help you focus on a time of specific interest. Selecting the Last Cutoff only and no group value will create a one-line summary report.
Filter
You can apply a filter to the report to further narrow your selection of activities.