Analyze
Once you have finished creating your project risk model, you can use the Safran Risk Simulation Engine to analyze the actual impact of risks and uncertainties on your schedule’s finish date and cost.
The Analyze tab
Once the model is complete it can be simulated from the analysis tab. All the tabs to the left of this tab describes the model and all the tabs to the right display the results of the risk analysis.
When you click ‘Run Analysis’ Safran Risk will simulate your project a number of times, each time selecting values from the distribution shapes you have previously defined and assessing their impacts on the specified activities based upon the probability and impact values calculated for that iteration.
When the analysis has completed, Safran automatically opens the ‘Distribution Graph’ so you can start to review the results.
Included Risks
Prior to running a risk analysis you can select which risks you would like to include, this allows you to easily model different scenarios where you may wish to see the effects of completely mitigating certain risks while others will be impacted or compare the effects of the Pre vs Post mitigated positions of certain risks. The default position is that all risks should be included in the analysis.
Safran Risk also provides some simple analysis options where you can define the number of iterations to simulate, whether you would like to use a seed value, to include correlations and/or to level the resource after each iteration.
Analysis Options
There’s a number of options that you can set which will impact the result of the analysis.
.png)
Iterations
A number that determines how many times the project will be simulated during the risk analysis.
Stop at Convergence
An option that allows you to stop the analysis when convergence of certain results have been reached instead of running all the iterations. The type of convergence to check for is set by clicking on the button that will appear if you select the checkbox.
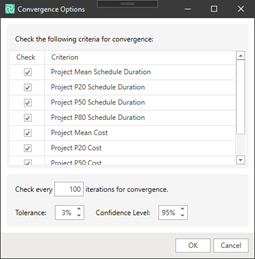
In the list you select which values to check. All the selected values will have to converge for the analysis to stop. The available percentiles are based on the focus percentiles. The focus percentiles can be set in the Options part of most of the output tabs. E.g. Distribution Graph or Drivers.
The three parameters at the bottom determine how often to check for convergence and the certainty that is desired. In the dialog above we will check for convergence after every 100 iterations and we want to be 95% certain that the results for the selected values are within +- 3 % of the analysis result.
Safran Risk calculates the convergence of means using the student cumulative distribution function. Safran Risk calculates the convergence for percentiles using the following technique:
Distribution-Free Confidence Intervals for Percentiles.
Seed
Seeds are integers that are used for generating the exact sequence of pseudorandom numbers for Safran Risk simulation modeling. With a blank seed value, Safran will run the simulation every time with a randomly selected seed number. However, as we have selected a fixed seed value, the simulation results will be reproducible every time the analysis is run.
Using seed values are beneficial for developing risk models as you can change your risk model and clearly see how your results are affected by the changes alone and not the effects of any randomization.
Use Latin Hypercube Sampling
This determines how the values will be sampled from the distributions during the risk analysis. If not selected a completely random sample will be taken each iteration. If selected, the analysis makes sure to sample evenly from the entire distribution. This leads to quicker convergence for small models.
Include Correlations
With this option checked the values set in the correlation tab will affect the result of the analysis.
Resource level after each iteration
If this option is selected, then whichever resource levelling options are supplied in the schedule tab will be applied to each iteration of the risk analysis.
Calculate Float
Select this to include "Total float" as one of the distribution types in the Distribution graph. Calculating float requires additional computations during the risk analysis (the CPM backward pass), which will slow down the analysis. Therefore, this is provided as an option rather than being enabled by default.
Step Through
If you want to see what the schedule looks like during each iteration you can select this option. To be able to see how the schedule is affected by the risks is a great way to verify that your model is correct.
Focus Activities and Focus Costs
The focus activities and costs in Safran Risk are elements in your project that you have a special interest in. They would typically be major milestones in a project. Adding focus activities and focus costs lets you do a few extra things:
• Show only the focus activities/costs in the Distribution Graph tab. This lets you quickly have a look at the results that really matter to you.
• Calculate how the exclusion of a risk affect the finish date and cost of a focus activity in the Sensitivity tab.
• Calculate how the exclusion of a risk affect the cost of a focus cost in the Sensitivity tab.
Create a report Package
At the end of a Risk Analysis session you normally want to create a report. This is often done using Word or PowerPoint. Charts from Safran Risk are exported and inserted into the report document. This can be a very time-consuming task.
Imagine for example that you’ve exported 30 charts from Safran Risk and included them in your report, but then you realize that you need to change the model. You now need to re-run the analysis and update all the charts in your report. The Report Package generator helps to speed this up.
In the ribbon menu of the Analyze tab there is an icon called “Report”.
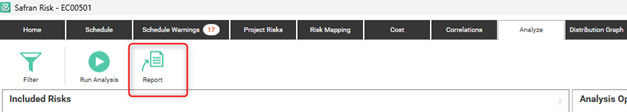
When you click this button you will see the following dialog:
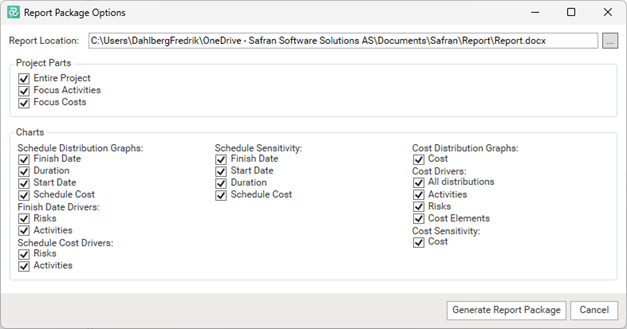
Here you can select which charts you want to generate and where to save them. When you press “Generate Report Package” all the necessary analysis will be run in the background and the charts will be generated as .png image files. You will also get an example word report and an excel sheet with a summary of the project.
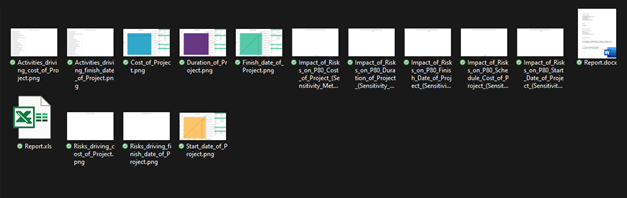
The output folder will look something like this after running the report generator:
Note that in order to create charts for summaries, Activities and cost elements you need to add them as Focus Activities or Focus Costs.
To create a report where the images will be updated automatically you can create your own report (e.g., in Word or PowerPoint) where you add the images from the report package folder by reference. It will look like this in Word:
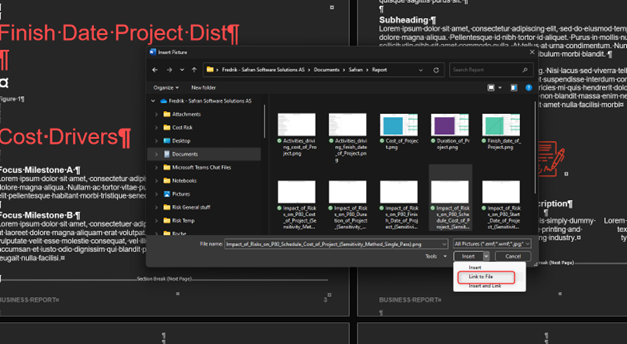
By selecting “Link to File” the word document will be updated automatically if the file changes. The file will change if you change the model and re-run the Report Package Generator.
Now you can create a report with a large number of charts and have it updated in seconds!