Distributions
Triangle
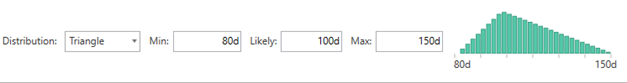
The triangle distribution is a continuous probability distribution with lower limit Min, upper limit Max and mode Likely, where Min < Max and Min ≤ Likely ≤ Max.
Uniform
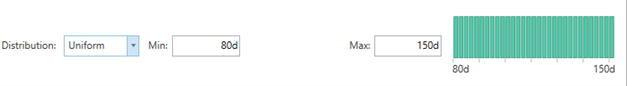
A uniform distribution only has a Min and a Max where Min < Max. The outcomes are uniformly distributed between the min and max.
Can be used when only the extremes are known, but there’s no information about the probability of the outcomes between the extremes.
Trigen
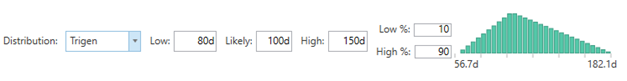
Trigen is another way of creating a Triangle distribution. Instead of entering the Extreme values (Min and Max) you enter two percentiles called Low and High. These percentiles can be set in the fields called Low% and High%. If you for example set Low% to 10 it means that 10% of the outcomes will fall below the Low value.
Trigen can be used if you think the ranges given are understating the risk.
Normal
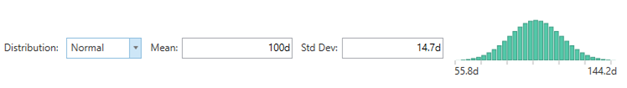
A Normal (or Gaussian or Gauss or Laplace–Gauss) distribution is a type of continuous probability distribution for a real-valued random variable. It is defined by the Mean and the Standard Deviation.
Cumulative
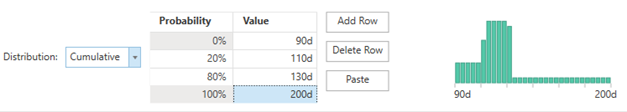
The cumulative distribution lets you define a distribution by entering the probability of a number of ranges. In the example above we can see that 20% of the outcomes will fall between 110 and 90 days. 60% will fall between 130 and 110 days etc.
Discrete
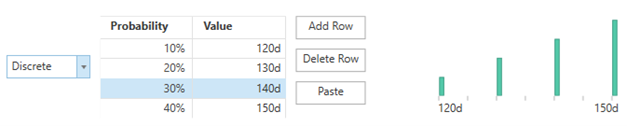
The Discrete distribution lets you define a distribution by entering the probability for a number of specific outcomes. In the example above only 4 out comes are possible.
BetaPert
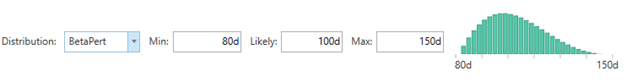
The BetaPert distribution is used in a similar way to the Triangle distribution. The difference is that for BetaPert more weight is given to the Likely value.
LogNormal
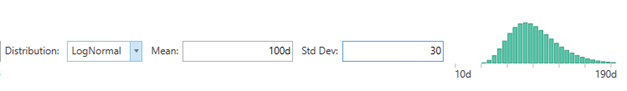
The difference between Normal and LogNormal is in its shape: the normal distribution is symmetrical, whereas the lognormal distribution is not. The lognormal distribution has a right-skewed curve
SplitTriangle
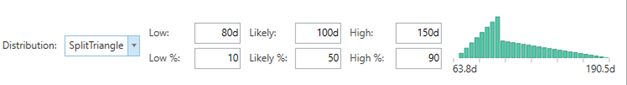
Split triangle distribution is similar to Trigen. But in addition to being able to say which percentile the low and high values represent you can also say which percentile the Likely value represent.
The result of this will be two triangles, one for the portion above ML and one for the portion below.