Costs
The cost tab allows you to create a cost risk model that can be independent of or integrated with the schedule. It allows you to model costs and their associated uncertainties and risks. When the model is run together with a schedule you get an integrated cost schedule risk analysis.
When you want to perform an integrated cost schedule risk analysis (ICSRA), the main idea is that the schedule is driving the costs. This is achieved by connecting costs to activities in the schedule. The costs will then vary in proportion to the duration of the activities during the risk analysis.
An alternative way to do an ICSRA is to use the cost loaded resources in the schedule tab. In Safran Risk you will have to use either the schedule resource method or the cost tab. There’s not currently a way to combine the two in any meaningful way.
When you use the cost tab for modeling costs all the cost results in the output tabs can be found by clicking the Cost icon in the ribbon.
Activation
If your used license key includes the Cost Module you will see a tab called “Cost” to the right of the “Schedule” tab. If you don’t see this tab and would like to access the cost functionality, please contact Safran Software Solutions Support.
Importing and Exporting
Excel
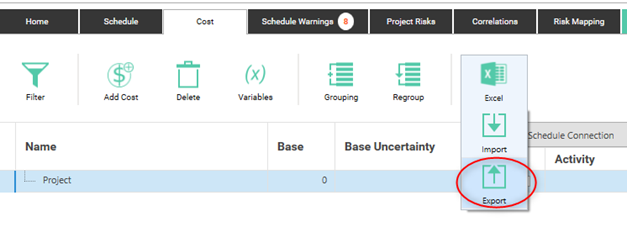
A Cost Breakdown Structure (CBS) can easily be imported from excel. This is done by adding your costs to the Safran Risk Cost Import Template. To create a template, you can just export an empty cost model.
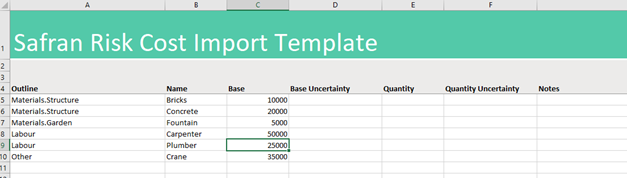
After you’ve opened the template in excel you can add your costs there in any way you like. This will result in an excel document that looks like this:
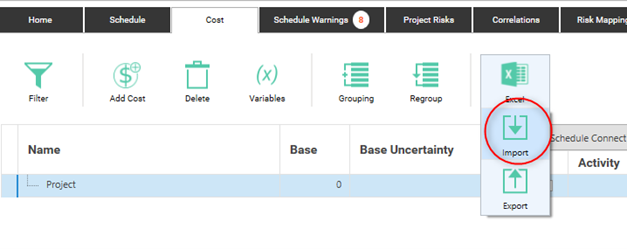
Once you’ve added all your costs to template, you save it, go back to Safran Risk and click Import.
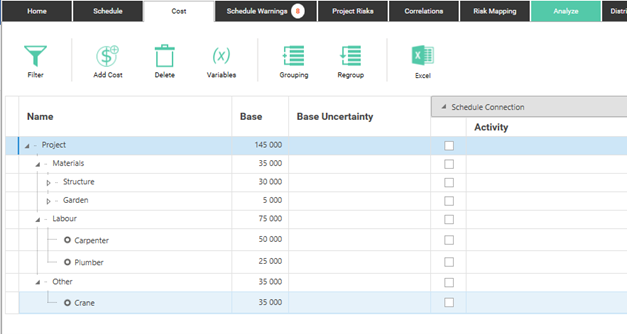
In Safran Risk the costs will look like this:
You can also use the Excel import/export functionality to modify existing costs in excel.
XML
If you’d like to move your costs from one Safran Risk project to another, the recommended way is to use the export/import risk model functionality. The costs are part of the risk model. The export / import risk model functionality is situated on the Home tab.
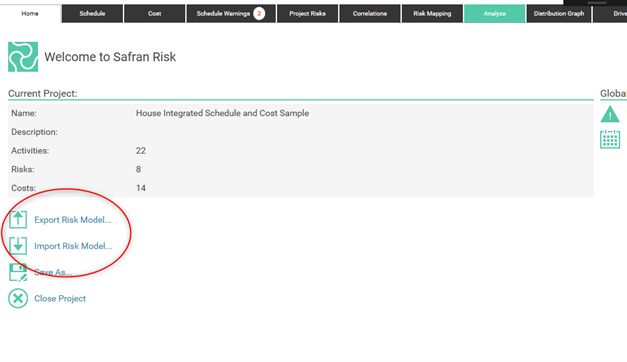
When you export a risk model and import it into another project, all the mappings between costs, risks and activities will be maintained.
Grouping and Ordering of Costs
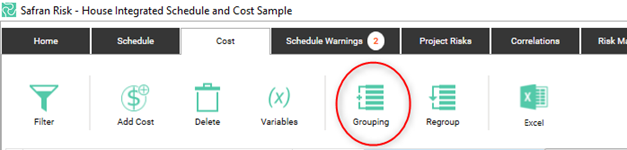
To group the costs you need to add an outline structure. This is done by clicking the grouping button.
In the Grouping dialog you use the Add, Remove and Edit buttons to create an outline. To edit the names of the nodes you can either click edit, or double click on the node. It is also possible to change the structure by dragging and dropping the nodes.
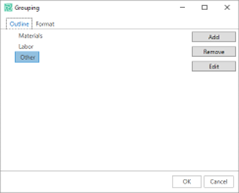
If you want to change the background color of the group heading, you can do this in the Format tab in the Grouping dialog.
All the costs are ordered and grouped as they are added. If you, for example, have selected a cost in a group and you click “Add Cost”, the new cost will be added to that group. You can move the costs around, inside one group, or from one group to another, by drag and drop.
Integrating Cost and Schedule
The first part of integrating cost and schedule is getting both schedule and costs into the same project. If you start with a schedule, adding costs should not pose a problem. You can just add the costs or import them from excel or as part of a risk model xml file. If you start with a cost model and want to add a schedule these are a couple of different methods you can use:
First method:
First method:
-
Close down your project.
-
From the Home tab, choose one of the import options.
-
In the Project Import dialog, select the project that you would like to add the schedule to.
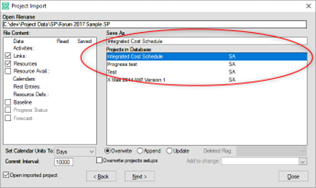
- When you get to save, you will get the following dialog:
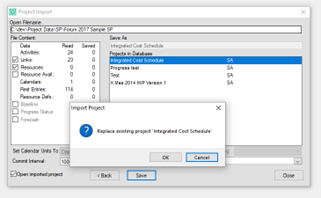
-
Click ok. Only the schedule will be overwritten, not the costs.
-
Now you should have both a schedule and costs in your project.
Second Method
- In the project with the costs, go to the home tab
- Select “Export Risk Model”. This will export your costs together with your risks to an xml file.
- Close down the project.
- Import the schedule into a new project.
- Go to the home tab and click “Import Risk Model”.
- Find the file you imported before and import it.
- You should now have a project with both a schedule and costs. You can now start integrating them!
The connection between Schedule and Cost is handled in the Schedule Connection section.
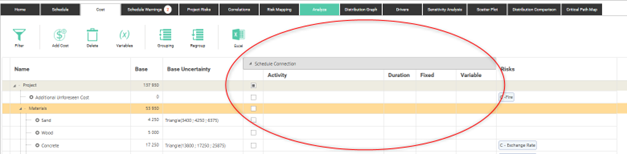
In here you can let a cost be driven by one or more activities. This connection can be turned on and off by clicking the check box in the first column of the schedule connection section.
To connect a cost to the schedule, you select the check box, and then you click the schedule button in the Activity column.
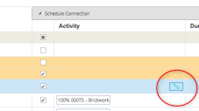
This displays the following dialog:
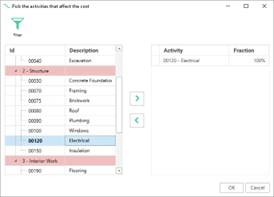
In this dialog you can pick one or more activities that will be driving the cost. On each activity you can set a fraction between 1 and 100%. This represents the part of the cost that is affected by a particular activity. During the risk analysis the cost will now change proportionally with the change in duration of the activities. When the duration is longer than the deterministic, the cost will increase, and when the duration is shorter than the deterministic, the cost will decrease.
The formula for this relationship that is used in each iteration during the risk analysis looks like this:
Example:
Base Cost: 1000
Fraction: 100%
Duration in Iteration: 150
Deterministic Duration: 100
If you’re using fractions with multiple activities the formula looks like this (Note that the sum of fractions can’t be more than 100%).
Example with two activities (A and B) driving one cost:
Base Cost: 1000
Fraction of cost affected by activity A: 50%
Probabilistic Duration of activity A: 150 (longer than deterministic)
Deterministic Duration of Activity A: 100
Fraction of cost affected by activity B: 25%
Probabilistic Duration of activity B: 170 (shorter than deterministic)
Deterministic Duration of Activity B: 200
Mapping Risks to Costs
Some costs are affected by risks. This can be modeled by adding the risks in the Risks column.
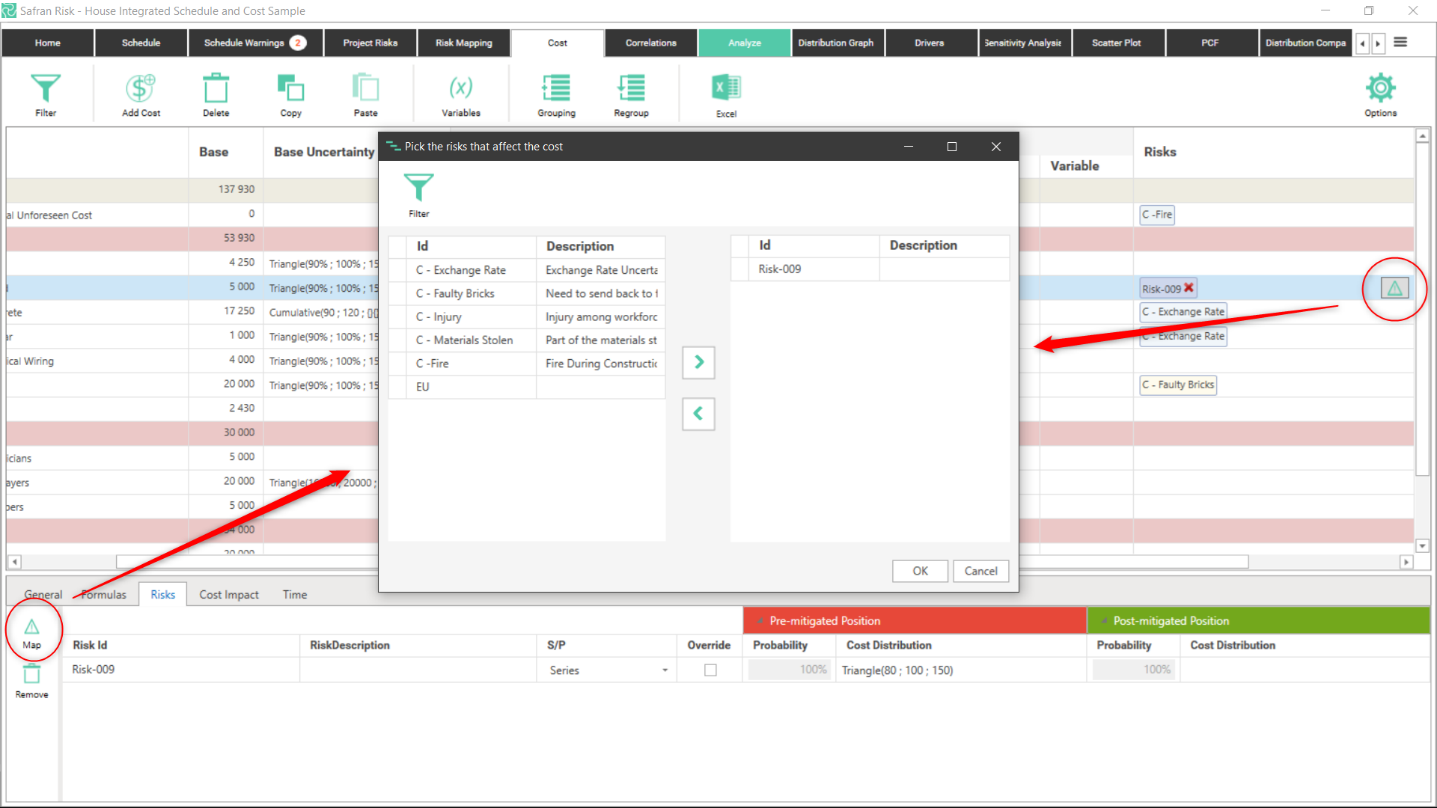
In the risks column, you add the risk either by clicking the button or typing in the grid cell or by clicking the button in Risks tab in the Cost Element details section. When you type only the risks containing the typed characters will be shown. To delete a mapping to a risk you just click the little X on the risk. You can also delete a risk mapping by deselecting it in the risk selection dialog and cling ok.
The risks available in the cost tab are the ones that have been defined in the Project Risk tab with a cost impact.
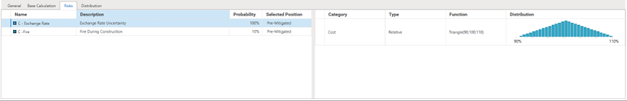
In the cost details window, you can see some more detail about the risk. To edit the risk however, you have to go to the Project Risk Tab.
Overriding the risk impact on Cost Element
In the risks tab on the details section the risk impact can be overridden by checking the Override checkbox. This allows you to change the impact a risk has on a particular activity. It works in the same was as when overriding risk impact in the Risk Mapping tab. For more info on this see the Override section in the Risk Mapping chapter (Overriding Risks at activity level).
The order in which the risks impact one Cost Element is the following:
- All relative in series impacts are multiplied.
- The parallel impact with the greatest impact (out of both the absolute and relative) is added.
- All absolute in series impacts are added.
A mathematical way of expressing this:

X: Deterministic or value from distribution if uncertainty defined
Irs: Relative in series impacts
Ias: Absolute in series impacts
Irp: Relative in parallel impacts
Iap: Absolute in parallel impacts
Input Fields
Sometimes it is desirable to model costs as a function of values in multiple columns. You might for example want one column called Unit Price with the price per unit and one called Quantity where you can enter a number of units. This can be achieved in Safran Risk by using Input Fields.
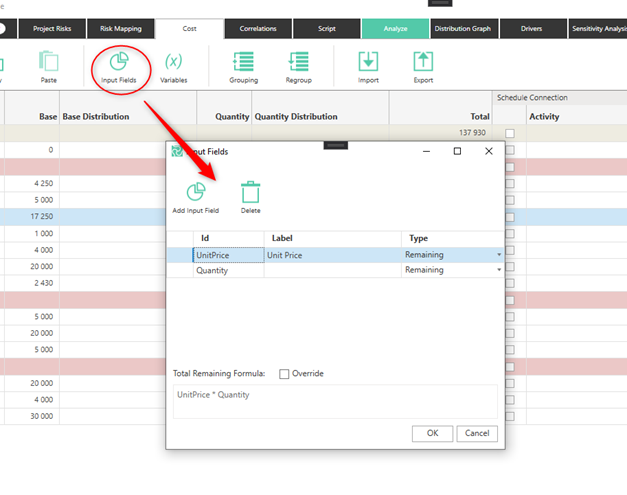
In the Input Fields dialog you can add any number of Input Fields. The fields will be displayed as columns in the cost tab. When you have more than one field you will automatically get an extra column called Total. This column will display the result of the other fields. The Total value is by default calculated as the product of the fields but this can be changed in the formula file at the bottom of the Input Fields dialog.
It is the Total value that will be used when the cost element is affected by a Schedule Connection or Risks.
You can add two types of Input Fields, Actual and Remaining. Actual fields can’t have any uncertainty and their value can be excluded from the results after the analysis. The value of an actual field will always be added to the Total. Note that the Actual part of the total won’t be affected by Risks or the schedule connection.
The input fields formula
By default, the total is calculated as the product of all input fields. If an input field does not contain a value for a specific cost element, it is automatically excluded from the formula. This default behavior works well in most cases.
However, if you need a more advanced calculation, you can click "Override" to customize the formula.
Note: When you override the formula, Safran Risk can no longer automatically exclude empty input fields, as this might break your custom formula. An empty cell might lead to the formula not being able to evaluate.
In order to handle empty fields you need to tell Safran what to replace them with in the formula. This can be done using the "if" and "NotSet" function in your formula. For example:
F1 + if(NotSet(F2), 1, F2) * if(NotSet(F3), 1, F3)
In this example, if F2 or F3 is empty, they are replaced with 1 during the calculation.
Formulas and Variables
Instead of just typing in a value, Safran Risk allows you to calculate the cost based on variables, durations from the schedule and other costs or cost groups. Variables can be useful if you want to include variation from common factors in the risk model. You can for example create variables for the weight of an oil platform or an exchange rate and let many costs be based on these values.
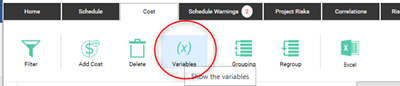
Creating a variable
To create a variable, you click on the Variables icon:
This will display the following dialog:
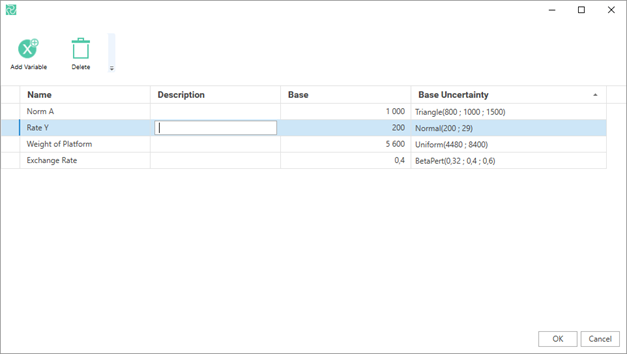
In here you can create the variables that you want to base your cost calculations on. Each variable has a base value that can vary according to a defined base uncertainty.
Calculating a value using a formula
In order to calculate the value, you need to select the cost and then select the “Formulas” tab in the cost details panel.
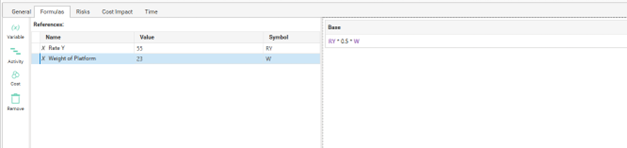
In here you add the references (variables, activities or other costs) that you like to base your calculation on. You can give your references a symbol that you use in the formula. For an example, see the screenshot above. Note that you can have a formula for each input field.
The Formula Editor
The formula editor gives you the possibility to do advanced calculations based on the references that you’ve chosen. In addition to standard operators, it supports the following functions:
| Function | Description |
|---|---|
| Date(year, month, day) | Returns a date that can be used as part of the calculation |
| Days(date 1, date 2) | Returns the difference in days between two dates |
| Min(value 1, value 2) | Returns the smallest of two values |
| Max(value 1, value 2) | Returns the greatest of two values |
| if(test, value 1, value 2) | Returns one of two values based on a test. The test must return true or false. |
Example 1: Modeling a penalty:
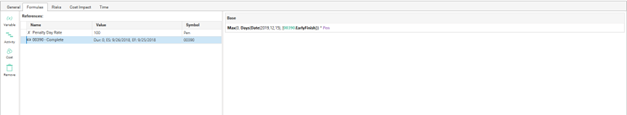
Formula: Max(0, Days(Date(2019,2,15), [00010.EarlyFinish])) * Pen
This models a penalty which is incurred if the activity with ID 00010 finishes after 15 February 2019. The penalty day rate is taken from a variable given the Symbol “Pen”.
Example 2: Modeling an overhead cost
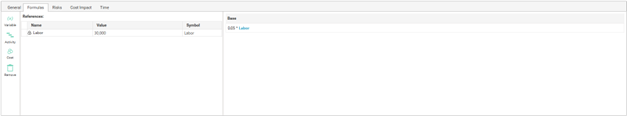
Formula: 0.05 * Labor
This formula references the cost of a group of cost elements. This cost is multiplied with 0.05 to get 1 % of the cost. Note that if you’re using a decimal value in the formula you need to always use “.” as decimal separator.