Critical Path Map
When schedule risks are being considered the traditional deterministic critical path is quite often no longer the most critical path.
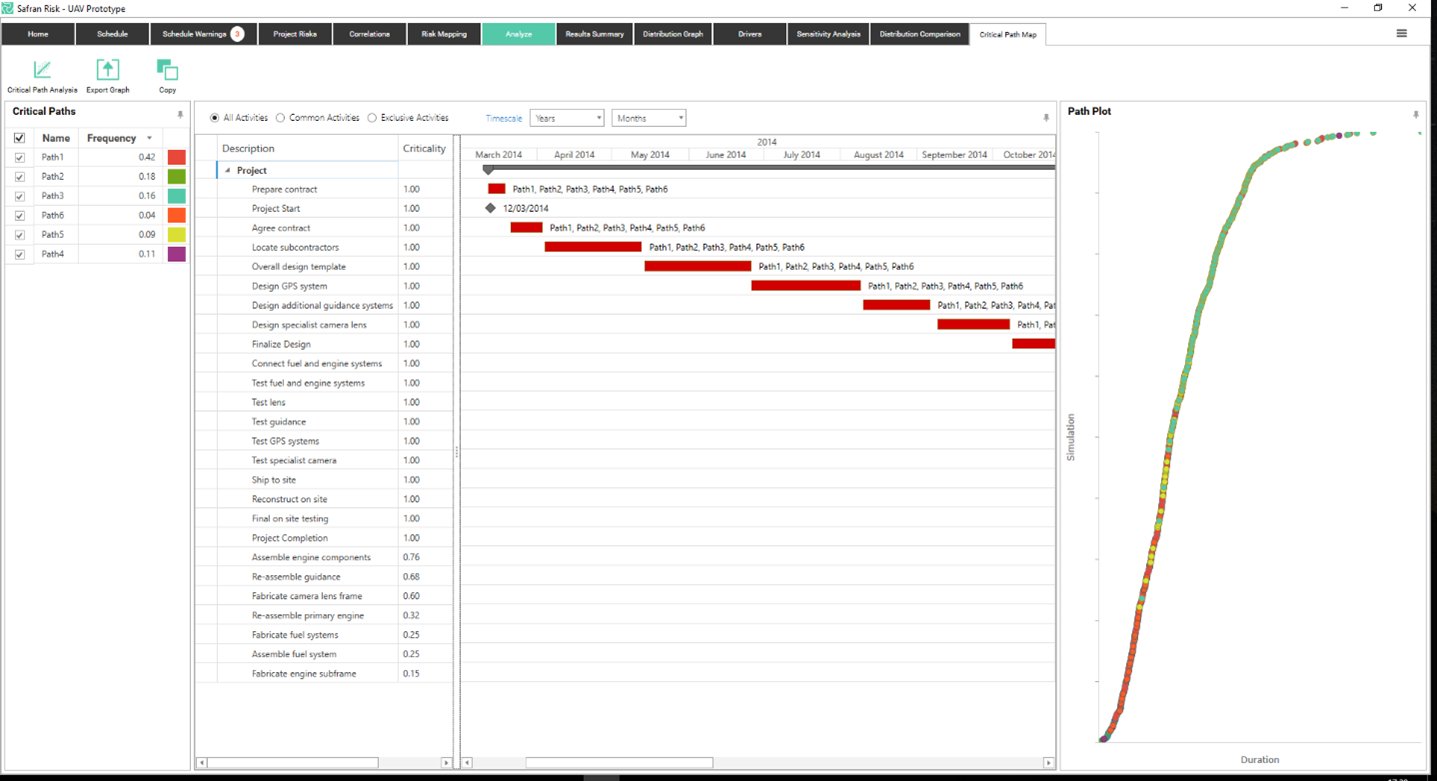
The Safran Risk Critical Path Map provides a detailed insight into the effects the risk model has on the activities and paths through the schedule.
Four main sections of the Critical Path Map
Schedule (End of path activity)
The point in the project that you want to see the critical paths for. This point can be the entire project or it can be an activity, typically a milestone. To see the critical paths for a certain activity you just find this activity in the tree and select it. You should now see how all the data in the rest of the view changes. Note that is not possible to see the critical paths for a summary. Only the entire project or an activity.
Critical Paths
The critical paths pane shows all the paths through the schedule that were critical during at least one of the risk simulations. The Frequency column indicates how often a path appeared as critical during the analysis, the color column corresponds to the points that are plotted on the path plot chart (see Path Plot), the checkbox allows you to show / hide activities on the selected path in the Gantt View and also the related points on the path plot.
Gantt View
The Gantt view pane, by default, shows all the activities that were critical during the analysis.
The data table shows how critical each activity was, ‘1’ means the activity always appeared on the critical path, it also shows the deterministic start and finish dates of each activity.
The Gantt chart shows these activities positioned according to their deterministic dates, it also shows all the paths that each activity was critical on, and this list is sorted initially on the criticality column (most critical first).
You can choose whether to see all the activities on the selected paths or a subset.
• All Activities will show you all the activities on the selected paths.
• Common Activities will show you all the activities that the selected paths have in common.
• Exclusive Activities will show you activities that are only on the selected paths and not on any other paths. (it all paths are selected it will show you the same as All activities)
Path Plot
The path plot pane provides a visual representation of exactly where on the curve each of the listed critical paths appear. Each dot represents one iteration colored by the path that was critical for that iteration and shows the relative duration of that iteration.
This can provide important information not traditionally available, for example, you may find that the path that appears to be critical with the highest frequency is largely isolated to those iterations with a smaller duration whereas paths that are critical less frequently are actually responsible for those iterations where the project completed in the longest duration.
The path plot can either be saved to a file (Export Graph) or copied to the clipboard (Copy).
The Gantt chart, shown centrally below, displays activities from the selected paths and how often each activity was critical during the analysis. The list can be filtered to display all activities, only activities that are exclusive to the selected paths or only activities that are common to the selected paths.
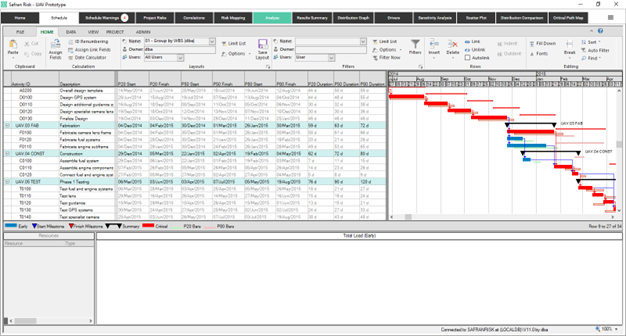
'P' Dates and Durations
It is possible to view the values for your selected focus percentiles in the gantt chart area of the Schedule tab.
As shown in the following screenshot, the percentile dates can be shown in both columns and also as bars alongside the deterministic bars in the gantt chart. In the example narrow bars are shown above the deterministic bars for the P80 start and finish dates and below the deterministic bars for the P20 start and finish dates. The percentile durations can also be shown as columns.
For more information on how to setup new columns and bars please refer to the ‘Layouts’ and ‘Symbols’ section of the Scheduling Chapter of this guide