Risk Calendars
Risk Calendars can be used to establish periods of uncertain downtime throughout the span of a project. They can be used to model various situations including seasonal storms, frozen sea etc. Risk calendars can highlight the consequences of changing the timing of a project. For example, weather-sensitive activities being moved to another season where they’re much more likely to be delayed. This kind of scenarios can’t be modelled just using uncertainty or standard risks.
The Risk Calendars tab is hidden by default. In order to see it you go to the Home screen and click “Edit Global Risk Calendars”. To close it down you can just click the x on the tab.
For example, a risk calendar may indicate that every December the risk of a heavy storm occurring in the North Sea is around 80 percent.
Risk Calendars allow you to create periods of uncertain downtime and show the generated downtime in a way that provides a visual validation of the expected downtime.
Note that including weather risk calendars in the model is highly likely to slow down the analysis substantially. This is especially true if the chosen scheduling unit is hours or minutes.
Generating Risk Calendars
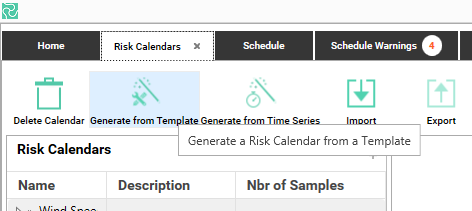
You can generate risk calendars in two ways:
- Generate from template
- Generate from time series.
Generating Risk Calendars from Template
When generating a template for the first time, there are a number of properties that need to be defined including description, start and finish, number of samples etc.
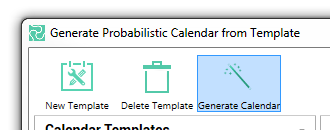
Clicking the Generate from Template icon will open a new window where you can to define and create your risk calendar.
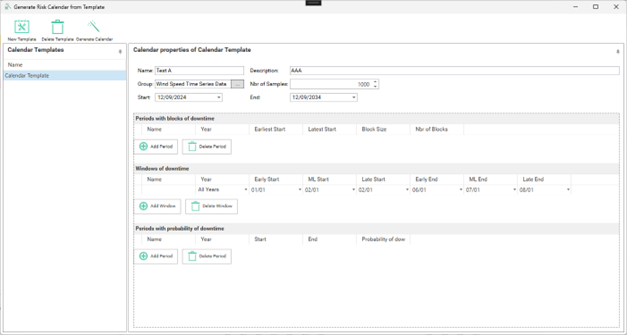
For each template, you may define the following information:
| Fields | Options |
|---|---|
| Name | Assign a calendar name |
| Description | Describe the purpose of creating the calendar |
| Group | Specify the calendar group |
| Number of Samples | Specify the number of samples you want to create |
| Start and End | Start and finish of the period you would like to create a calendar for |
| Downtime in whole days | Uses complete days when generating the calendar data |
| Periods with blocks of downtime | Name – Period name Year – Select either a year or all years of the calendar span Earliest Start – Specify the earliest start date of the period Latest Start – Specify the latest start date of the period Block Size – Select the distribution method or use fixed numbers Nbr of Blocks - Select the distribution method or use fixed numbers |
| Windows of downtime | Name – Window name Year – Select a year or all years of the calendar span Early Start – Specify the early start date of the window ML Start – Specify the most likely start date of the window Late Start – Specify the late start date of the window Early End – Specify the early end date of the window ML End – Specify the most likely end date of the window Late End – Specify the late end date of the window |
| Periods with a probability of downtime | Name – Period name Year – Select a year or all years of the calendar span Start – Specify the start date of the period End – Specify the end date of the period Probability of downtime – Specify the probability of each day being downtime in the period. If you for example set this to 50% on average 50% of the days in the period will be non working. The downside of this method compared to the “Periods with blocks of downtime” method is that you have no control of the min and max days of downtime in a period. |
Note that the ‘Periods with blocks of downtime’ is used for showing several downtimes in different period blocks which may happen across the calendar time span. You should use ‘Windows of downtime’ when you want to show typically larger periods of downtime where there is some uncertainty on the start and end of these periods e.g. the period a canal may freeze over each year.
In periods with blocks of downtime option, the uncertainty is on the number of blocks and their sizes, while in windows of downtime the uncertainty is on the start and end of this block.
After specifying the necessary information, click on the Generate Calendar icon and your template will be added to the risk calendars.
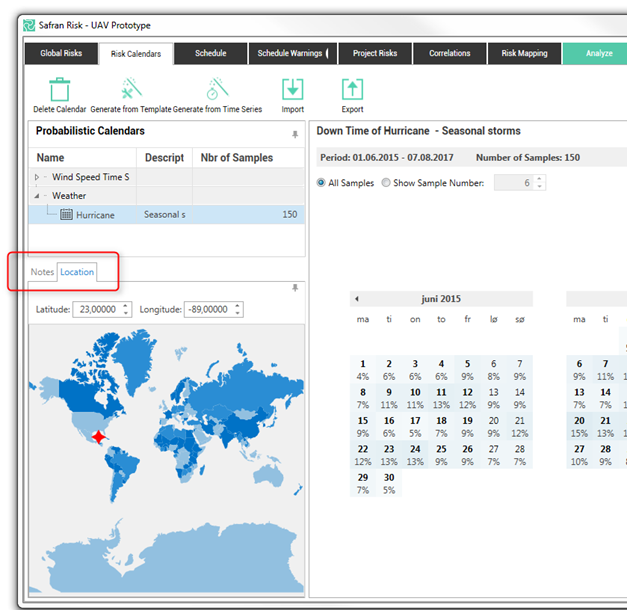
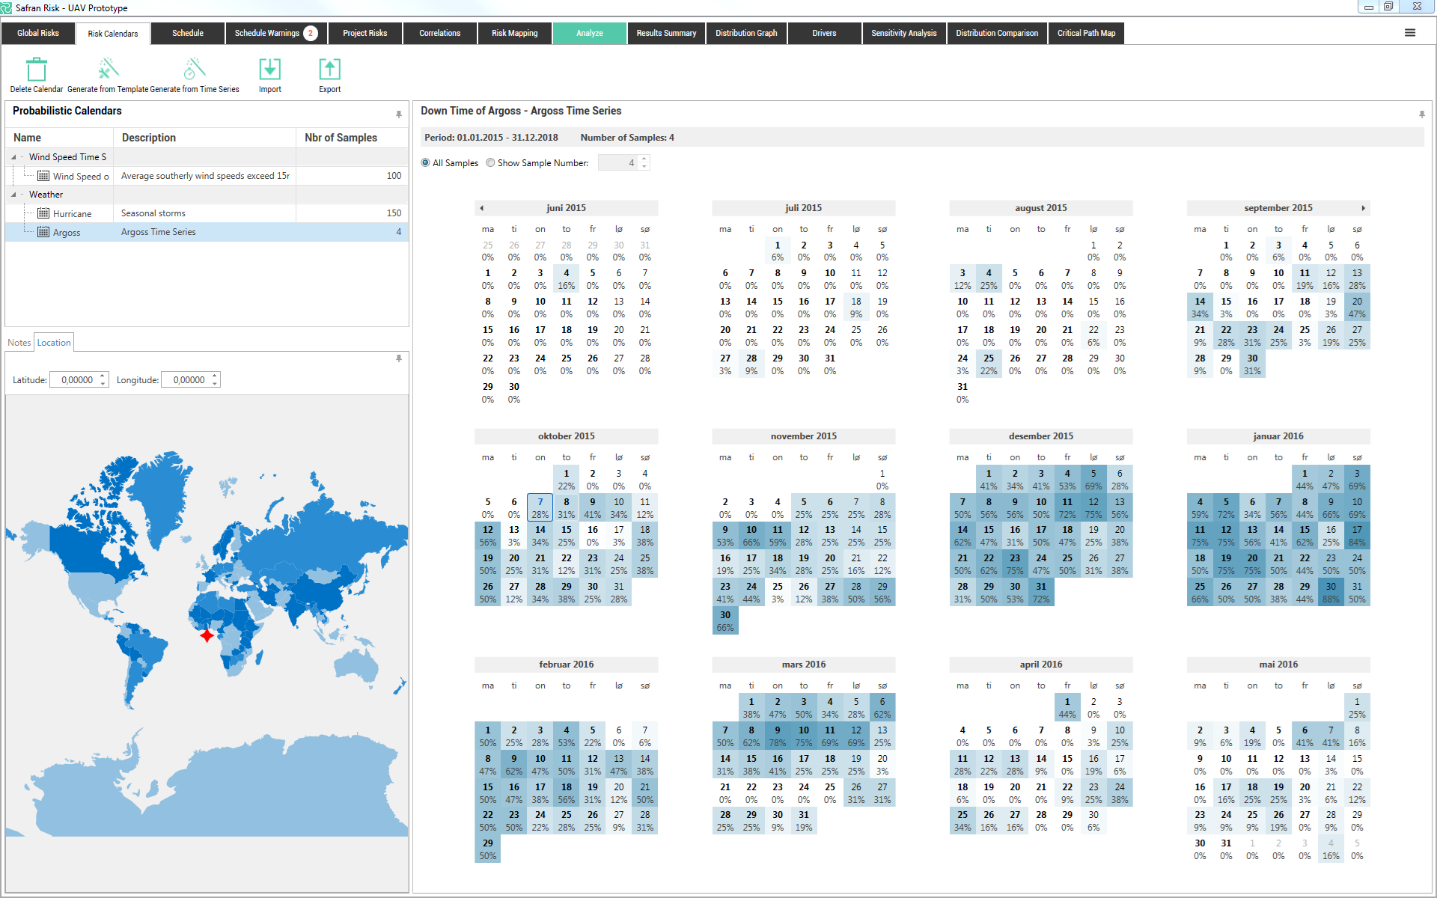
Now your template is visible in the calendar tree and you can choose to see all samples or only a specific sample number. You can also add notes or a geographical location to the generated calendar.
Generating Risk Calendars from Time Series
Time Series weather data is available from many different sources and can provide detailed information on weather conditions historically for a given location, this information can include factors such as wave height, wind speed, rain etc.
This information is often received in a spreadsheet format, Safran Risk can use this historical time series data to generate your risk calendar.
To enable Safran Risk to understand the time series information it must be transformed into a format that Safran Risk can understand.
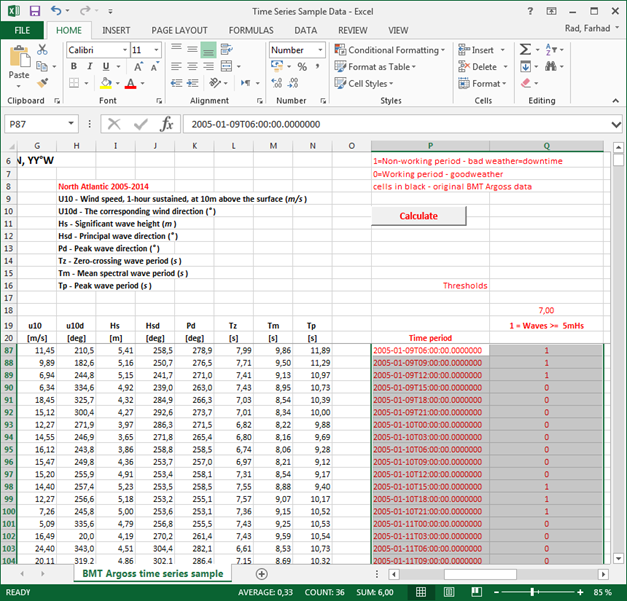
In order to create a useable risk calendar from time series, we need to select and import two columns, one with dates and the other one indicating whether this date represents a working or non-working period.
In the second column, you should transform the desired data into 0 and 1, for example, if waves higher than 7 meters will influence the project downtime, you can use 1 for the values more than 7 and use 0 for the smaller values.
An example of a typical spreadsheet, including the transformation of this data into a format Safran Risk can read is included in the Sample Data folder (%appdata%\Roaming\Safran\Risk\Sample Data\Time Series Sample Data.xlsm).
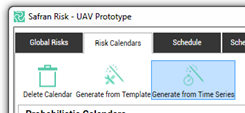
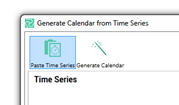
When these two columns are ready in your spreadsheet, copy them in the clipboard, then in Safran Risk, click on Generate from Time Series icon and in the opened window, click on Paste Time Series.
The copied data in clipboard will be transferred into Safran Risk. In the imported table, the downtime dates are blue.
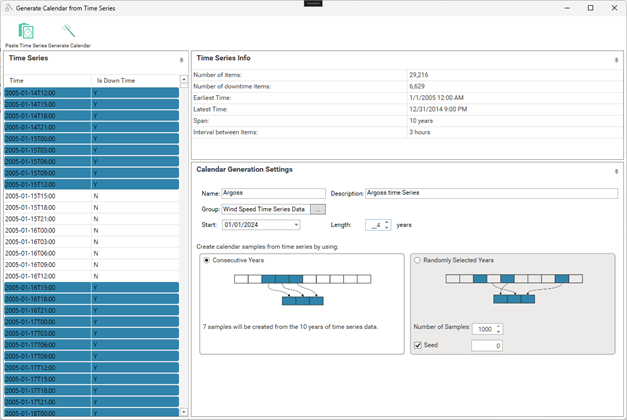
You can see some information about the imported time series on the right-hand side of the table e.g. the number of items, span etc.
In the Calendar Generation Setting window, you can assign the calendar information and select the style of sample you want from the two available options. If you select the Consecutive Years option, the taken samples will include continual years such as 2011, 2012, 2013, while the samples years in the other option will be randomly selected from the available data. When you are done with setting the new calendar, you can click on the Generate Calendar icon, this will create a new calendar which will appear in the list of probabilistic calendars.
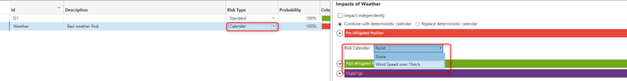
Mapping Risk Calendars to the Schedule
To have an impact on your model a Risk calendar must be mapped to one or more activities in the schedule. This is achieved by creating a risk of type Calendar. In the Impacts section of the risk you will find a drop down where you can select the risk calendar. This risk can now be mapped to an activity just like a normal risk. It is possible to map more than one Risk Calendar to an activity. The downtime of the two calendars will be merged.