This chapter contains a quick introduction to the “Schedule Health” module. The module offers a comprehensive view of all the issues in a schedule. The issues are checked via “tests” that contain “metrics”. It is for example possible to define a test that checks for all the issues mentioned in the DCMA14 standard.
The Schedule Health module replaced the old Schedule Warnings tab.
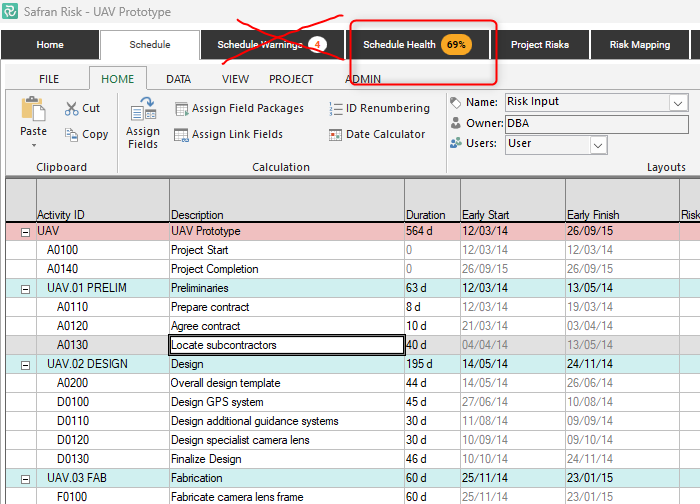
The Schedule Health module allows you to assess your schedule from many different perspectives. It can for example indicate how suitable a schedule is for risk analysis or how well it is aligned to scheduling standards such as the DCMA 14.
Whenever you open up a new schedule, Safran Risk automatically runs the Schedule Health analysis and displays the results in the Schedule Health tab.

In the tab you can see a report that shows you the status of your schedule based on a particular “Test”.
.png)
Layout
The default view under the Schedule Health tab is the Schedule Health report view. It has four main parts:
Dashboard
This is the top part where you can see the total test score, and the score for specific metrics that have been deemed to be of particular interest.
Schedule View
Here we can see the issues for each part of the schedule. To the left you can see the summaries and activities in your schedule and on the top there is one column for each metric. The metric columns with issues are moved to the left side of the table. This makes it easy to which parts of the schedule and which metrics that creates issues for a particular schedule.
Metrics View
In the bottom left corner there is a table containing one row per metric. The numbers here will change depending on which part of the schedule view that is selected.
Issues View
The table in the bottom right corner contains all the issues that the test found in the schedule. Here you can choose to comment or accept an issue.
Accepting an Issue
When you accept an issue, it will no longer contribute to the score. You should see the score and values in the report view update as soon as you change the accept state of an issue. If an accepted metric part of more than one test it will be accepted in all tests.
Tests and Metrics
The Safran Schedule Health is built on the concept of Metrics. A metric is quantitative or qualitative measure that assess the quality of an activity or a link. It can for example check if an activity has constraints or if a link has any lag.
The metrics can be grouped into “Tests”. Each test will be checking the schedule according to the included metrics.
Out of the box Safran Risk comes with several Tests and Metrics pre-defined. For many users these might be enough. More advanced users might however want to create their own tests and even their own metrics.
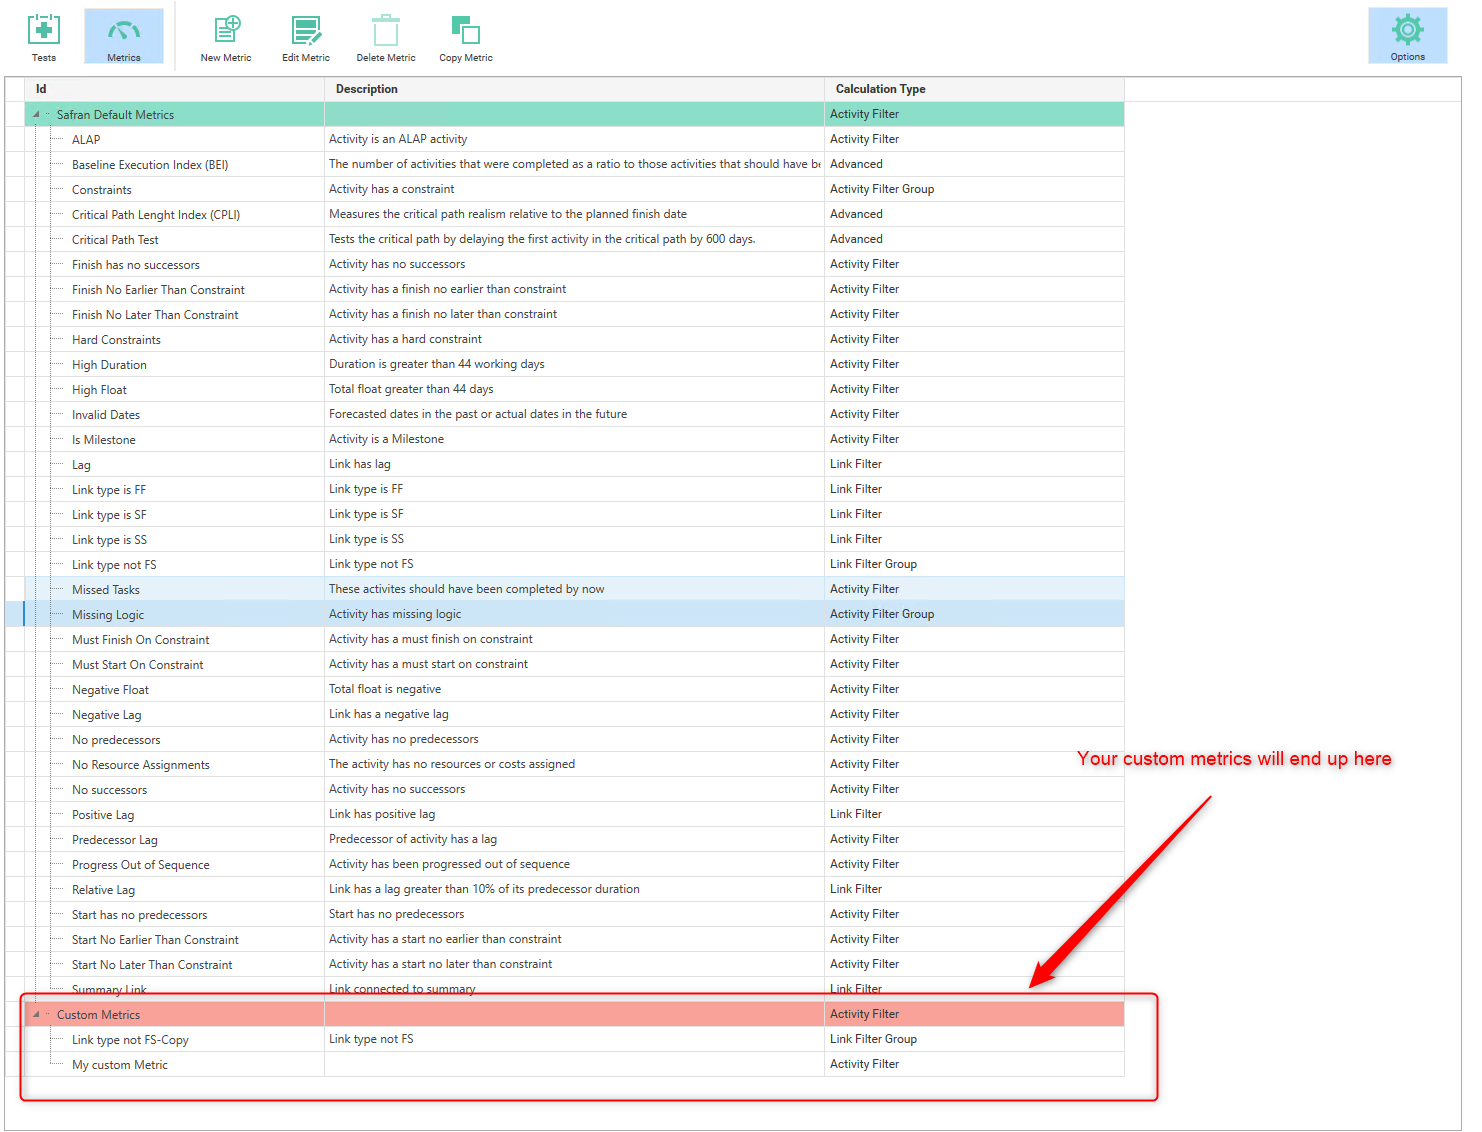
Tests and metrics can be added and modified by clicking on the options icon in the top right corner. When you do that, you will see this view:
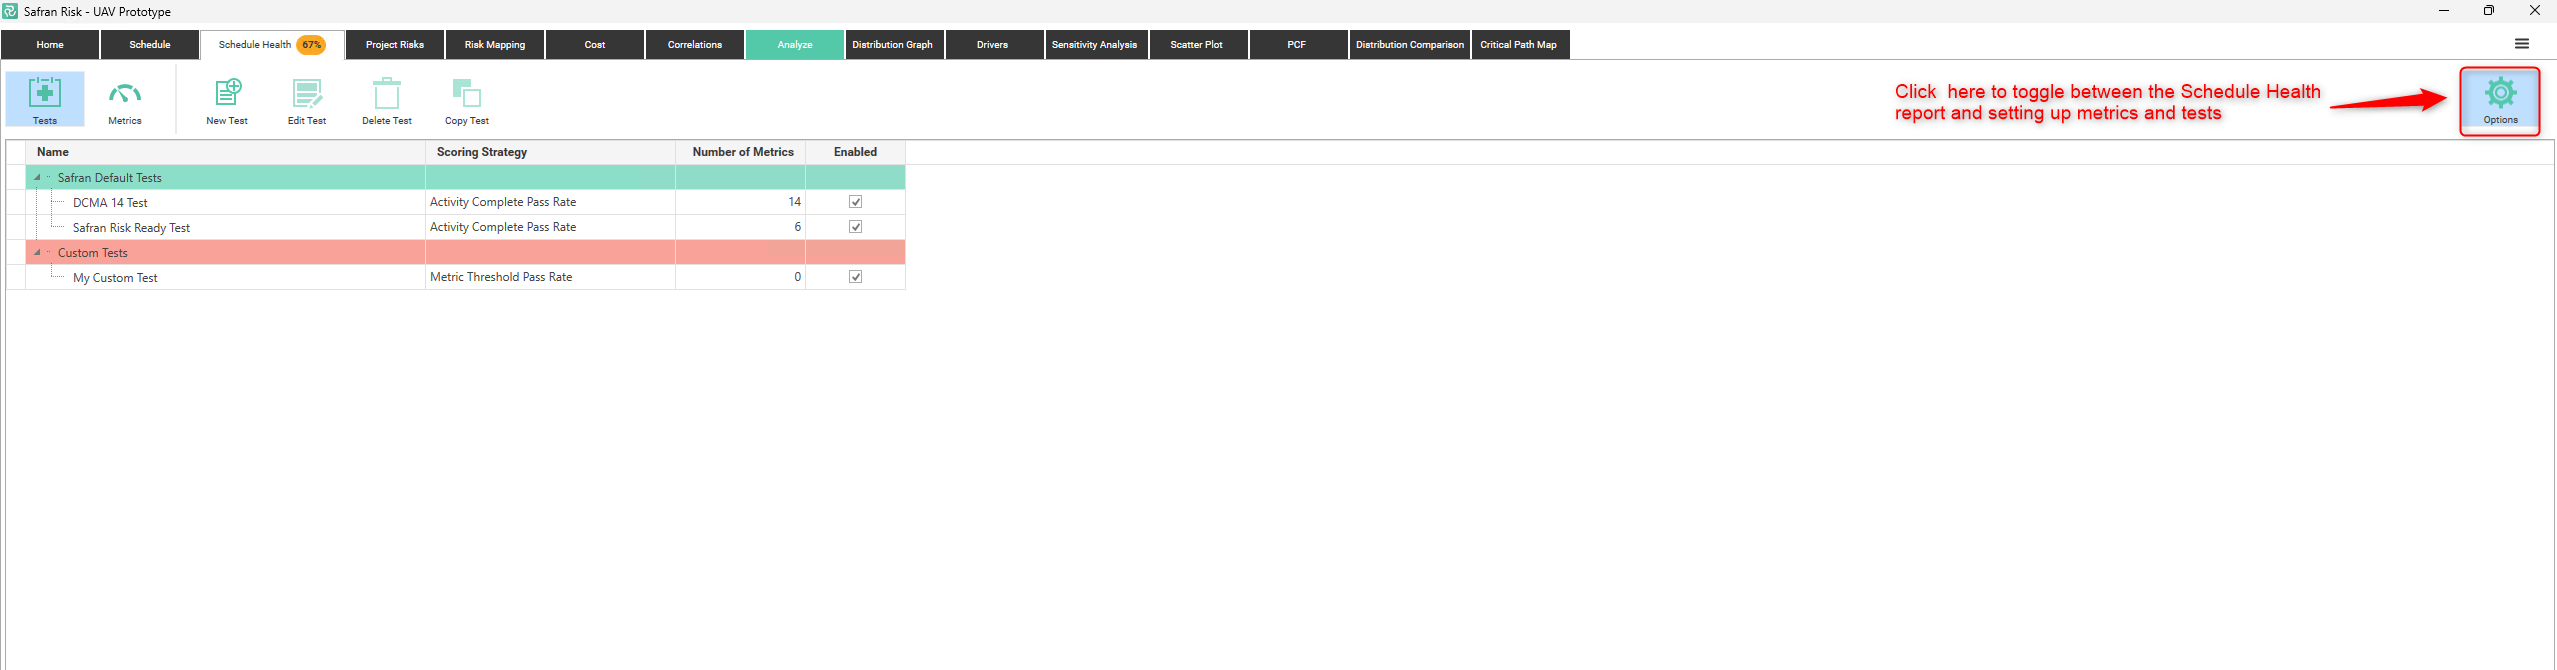
When you’re done editing tests and metrics you can click the options icon again. The schedule will be re-analyzed automatically when you go back.
Editing a Test
The main part of creating or editing a test is to pick which metrics that should be included. It’s possible to create tests by combining metrics from a large set of predefined metrics. You can also define new custom metrics.
You can edit a test by double clicking on it or clicking on “Edit Test” in the ribbon. Selecting the metrics for the test is done in this view.
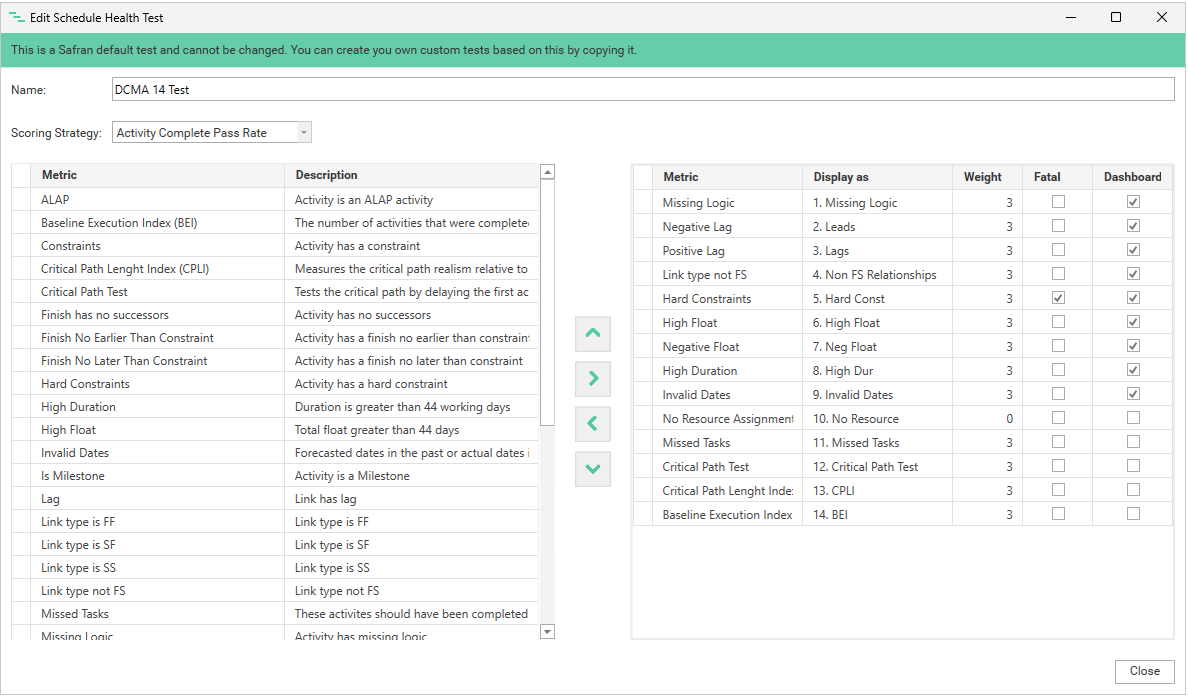
Note that it’s not possible to edit the Safran default tests. But you can always copy them to create a new test based on one of the default tests.
To select or deselect a metric you can use the right/left arrows in the middle or double click on the metric.
It’s possible to give the selected metrics a weighting. This will sometimes impact the score that the schedule receives. Whether it impacts or not depends on which “Scoring Strategy” that has been chosen.
You can also set a metric to be “fatal”. This means that if this metric fails the score will be set to 0.
If you feel that some metric is particularly useful you can show it in the dashboard. This is done by selecting it in the dashboard column.
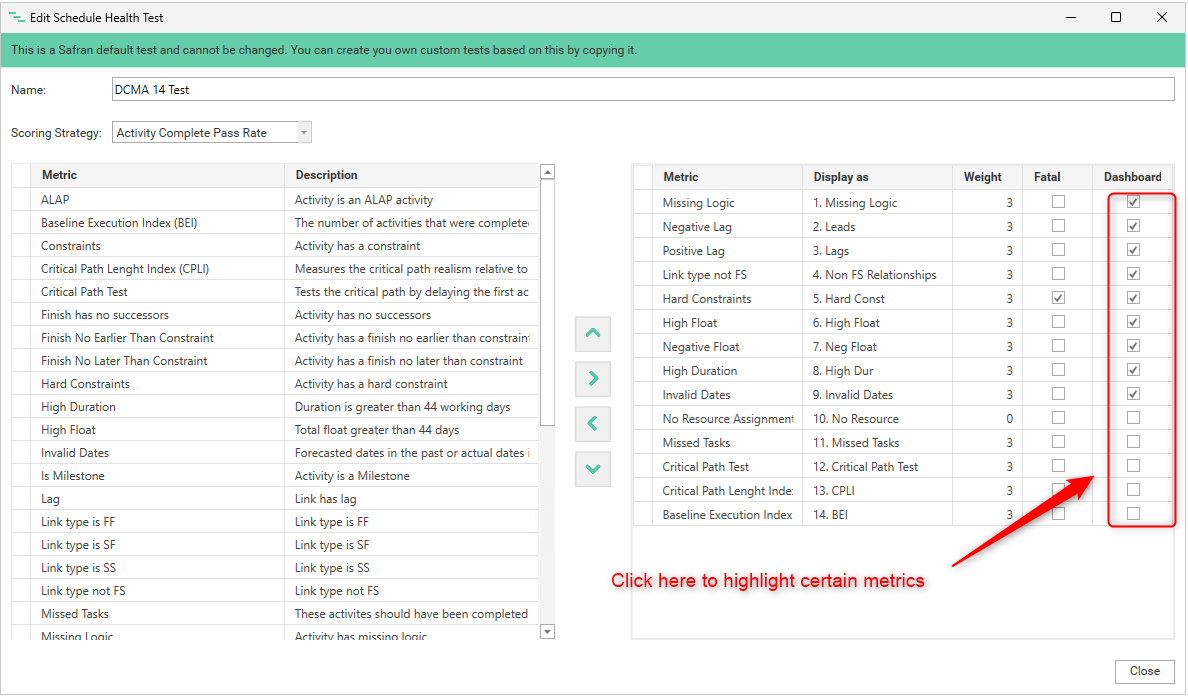
If you want the metric to have a different name in this particular test you can enter that display value in the “Display as” column. In the default DCMA 14 test we have for example added a number before each metric name.
Scoring Strategies
It is important to note that there are many ways to calculate a score for a schedule. The score depends on which metrics that are included, how they are weighted and which scoring strategy that has been used. Depending on those factors a score can change dramatically. Therefore you should not pay too much attention to the absolute value of a score.
But a score can be valuable when comparing schedules.
There are three scoring strategies in Safran. You select them at the test level.
Activity Complete Pass Rate
The number of activities without any failed metrics as a ratio of the total number of activities.Activity Partial Pass Rate
The average of the score per activity. The score per activity takes the metric weighting into account.Metric Threshold Pass Rate
The ratio of passed metrics (based on threshold defined for each metric) as a ratio of the total number of metrics. Here the weighting is taken into account.
Editing a Metric
As mentioned above Safran comes with many metrics defined, but should you feel the need to create new ones this is possible.
You can create a new metric by either clicking “New” to create a new one from scratch or select an existing one and click copy. It might be a good idea to study how the existing metrics are built before creating your own ones.
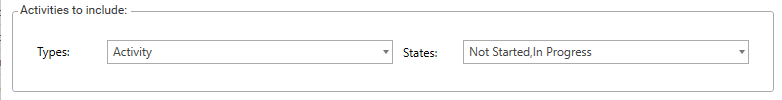
Activities to include
This section of the metric dialog lets you select which activities that should be considered for this metric. You might for example want to exclude completed activities or milestones from some metrics.
Calculation Type
In the “Edit Metric” dialog you can create several different types of metrics:
Activity filter – A metric that is checked for all the activities and returns true or false.
Activity filter Group – This is a metric that is built form several “Activity filter “ metrics. If any of the “sub-metrics” are true the filter group will also be true. An example is the “Missing Logic” metric.
Activity value – This is a metric that returns a value for each activity. It will not impact the score but can be used to show additional activity data in the schedule health results.
Link Filter – Same as activity filter but for links.
Link Filter Group – Same as activity filter group but for links.
Link Value - Same as activity value but for links
Formula
For all the metric types, except the two group types, the main part of the metric is a “Formula”. This calculates a value for each item (Activity or Link). For the filter metrics the formula has to evaluate to true or false. For the Activity value type the formula should evaluate to a number.
In the formula you can use values from the item. You do this by entering an “a” (for activity) or “l” (for link). After the “a” or “l” you type “.”. This will give you a list of all the possible values that you can use. It can look like this:
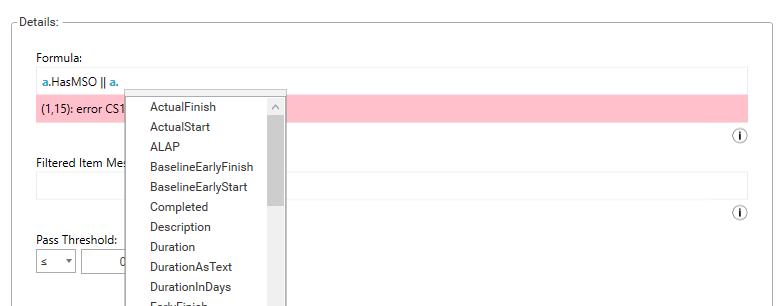
If there is something wrong in the formula an error text will be displayed.
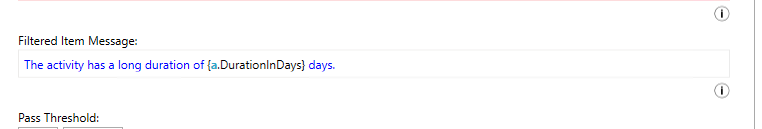
Filtered Item Message
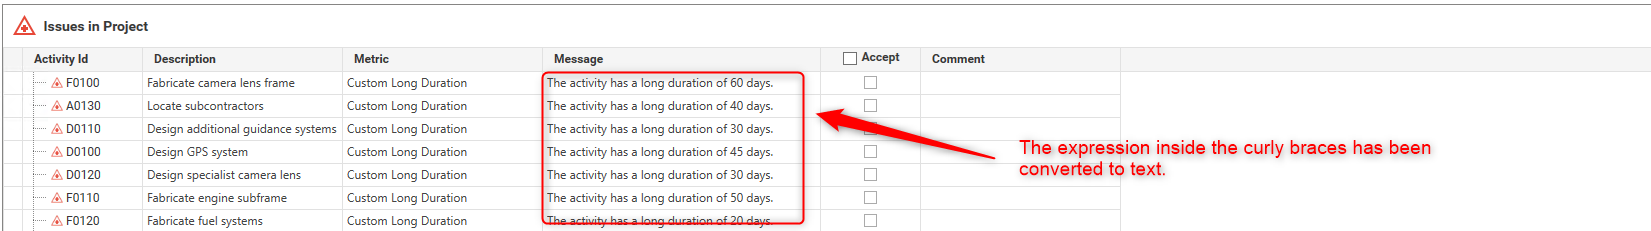
When a filter metric returns true a “Schedule Issue” will be created and displayed in the results view. This schedule issue can contain a message that can be defined here. You can use the same variables in the Filtered Item Message as in the formula. This is done by enclosing that part in curly brackets. It can for example look like this:
The result of this message will show up here in the results:
Pass Threshold
The pass threshold value will determine whether the test returns a pass or fail for a particular metric. This is also used to calculate the score if the Scoring Strategy is “Metric Threshold Pass Rate”.
Who can change the Tests and Metrics?
In version 25.1 all users can access the Tests and Metrics but going forward only users with special access will be able to change Tests and Metrics.
Setting access to this will be done from the Sys admin tool (not available yet).