The Barchart Editor
The Safran Project Barchart Editor is a feature-rich, interactive Gantt entry/review screen with complete, real-time CPM analysis. Activities may be moved, and durations changed interactively. The schedule impact of such changes and its changes to resource loading are visible immediately. Among the editor’s facilities is the ability to create and delete activities, move and stretch them, add or modify logic, and add, modify, or delete resource requirements. You can customize the Barchart Editor display to detailed activity information, resource entry and load information, logic information, and a customizable user-definable histogram.
Data may be copied within the editor or added by copy and paste from other software, such as Microsoft Excel, Microsoft Project, other scheduling tools, and more. Safran Project gives you control over the Barchart layout and presentation display. Configurable symbol options and activity annotation may be added to your layout. You can configure each activity's size, format, color, start and end symbols, and connector bars. You can draw multiple bars for each activity and define conditional bars. Safran Project also allows you to define summaries, grouping, and outlining flexibly to organize your schedule to best suit your needs. All customizations can be saved to named layouts for reuse, and you may switch between different layouts to display additional highlights.
You can use the Barchart Editor and the Safran Project Alternative Scheduling feature to evaluate different scenarios, alternative schedules, ‘what if’ analyses, and schedule impact analyses. The Barchart view is not only a means of adding, updating, and viewing project information. Due to its extensive flexibility, formatting, and printing capabilities, it may also serve as your favorite schedule-reporting tool. The Barchart Editor contains a complete Page Setup utility that allows you to format the pages of a professional-looking report, and together with the formatting capabilities of the editor workspace and layouts, this gives you complete control over the Barchart Editor reporting tool. The Barchart Editor layouts and the layouts for the customizable editor histogram may be included in the Report Package tool. The Barchart Editor may also be used to update Actual Progress and Expenditure. When studying this section, you should also look to the “Working with Logic” and “Specifying Resource Requirements” areas for details on adding logic and relations. It would be best to study the “Customizing and Printing Barchart Editor Histograms and S-Curves” section for more information on the histogram view and its features.
The screenshot below shows the Barchart Editor with the Logic Navigator information pane:
Barchart Editor Workspace
When opening a project, Safran Project automatically directs you to the Barchart Editor’s working environment.
The Barchart Editor workspace contains a quick-access toolbar, tabs, ribbons, a sheet bar, short-cut menus, layout options, a column or table area, a Gantt area, five different information panes, and two Barchart Editor views.
The five information panes allow you to view, enter, and update detailed activity information, link information and resources with a graphical display, and define a histogram display or report. Use the information options from the View ribbon, or select any information panes from the short-cut menu.
Depending on your license, a fifth pane—Schedule Risk—may be available.
The Activity Information, Link Information, Resource, and Histogram panes allow you to review detailed activity and project information in subsidiary windows. Once a subsidiary window is displayed, the information shown is synchronized with the activity selected in the barchart. The subsidiary windows may be used not only to display data but also to update or add information. This style of operation means that a user wishing to query project data only needs to select the appropriate information panel, select the windows containing the required data, and 'browse' through the plan by pointing and clicking on the relevant activities. The detailed information panel set with your Barchart Editor view is part of your layout, and layouts may be saved with a unique name and later used again. For more details on the Barchart Editor layouts, please look up Layouts. The detailed panes are not part of the Barchart Editor preview and printout, but the resource and histogram pane allow you to configure, preview, and print histograms independently. The histogram pane will even enable you to save its layouts as reports.
Choosing a View
The two views available for the Barchart Editor are the Group View and the Outline View.
These two views share most of the functionality available for the Barchart Editor. However, they differ in two areas: how the schedule is organized and how logic can be added and displayed.
Using the Group View in Safran, you can organize and group activities by standard code. Grouping enables you to focus on activities that have something in common. The activities within each group are organized into clusters. Organizing activities is helpful for project analysis and reporting while creating the project. Changing how activities are grouped and sorted allows you to focus on a project's different but equally important aspects.
You can build a non-coded hierarchy into your schedule using the outline view. An outline subdivides your plan into increasingly smaller amounts of work. The groups of work segments can represent phases in a project, rooms within a building, or specific buildings in a large construction site. When you outline a schedule, the Barchart schedule becomes more accessible to read, and you can locate individual activities quickly. An outline looks similar to Activity Grouping because it is hierarchical. However, unlike grouping, no codes are associated with titles or descriptions, and actual activities are used. In addition, you do not specifically assign outline codes to activities in an outline.
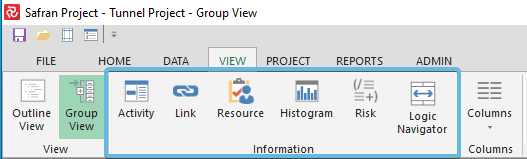
Selecting Information Panels
You may alternate between any of the six available information panels at any time by selecting the desired information from the ‘Information’ options in the View ribbon or the shortcut menu in the legend area.
The information panels contain a multitude of activity information fields that are all available as columns in the Barchart column area. Many fields are also available for symbol information in the bar area.
Any Information Panes are, by default, deployed at the bottom of your Barchart Editor workspace unless you open them in a new window, as described below.
Open in New Window
The shortcut menu (right-click) in all panels contains a practical option called ‘Open In New Window,’ which allows you to detach the current panel from the Barchart Editor window and work with multiple panels simultaneously, potentially across multiple screens.
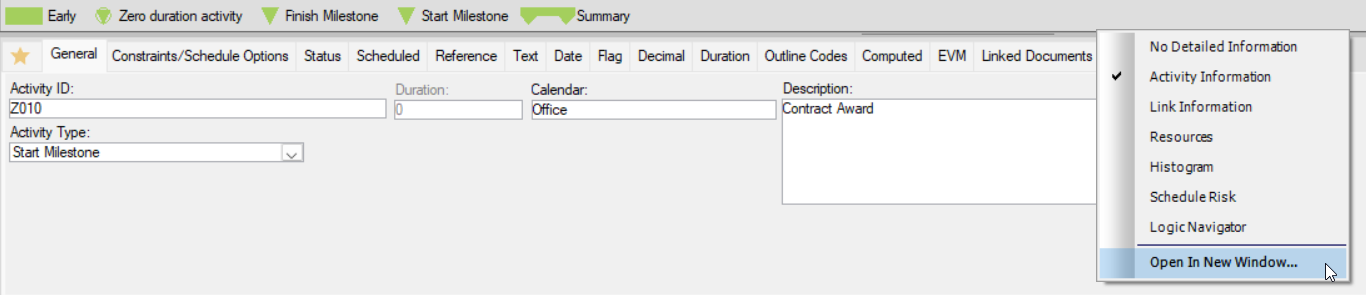
The 'Open in New Window' feature is accessible as shown above or directly from the shortcut menu (right-click) on the symbol legend:
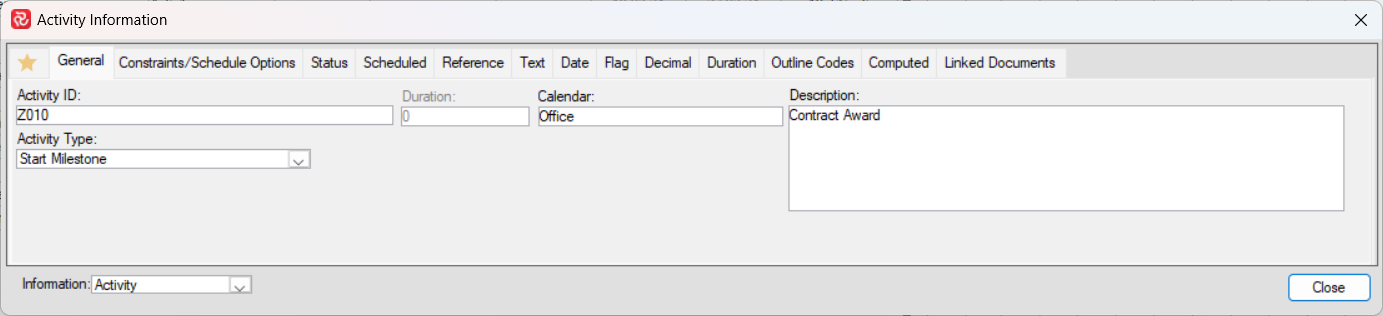
A third quick option for the 'Open in New Window' feature is to double-click on an activity, and it will take you to the 'Status' tab in Activity information. From there, you may select a different tab or a different Information pane:
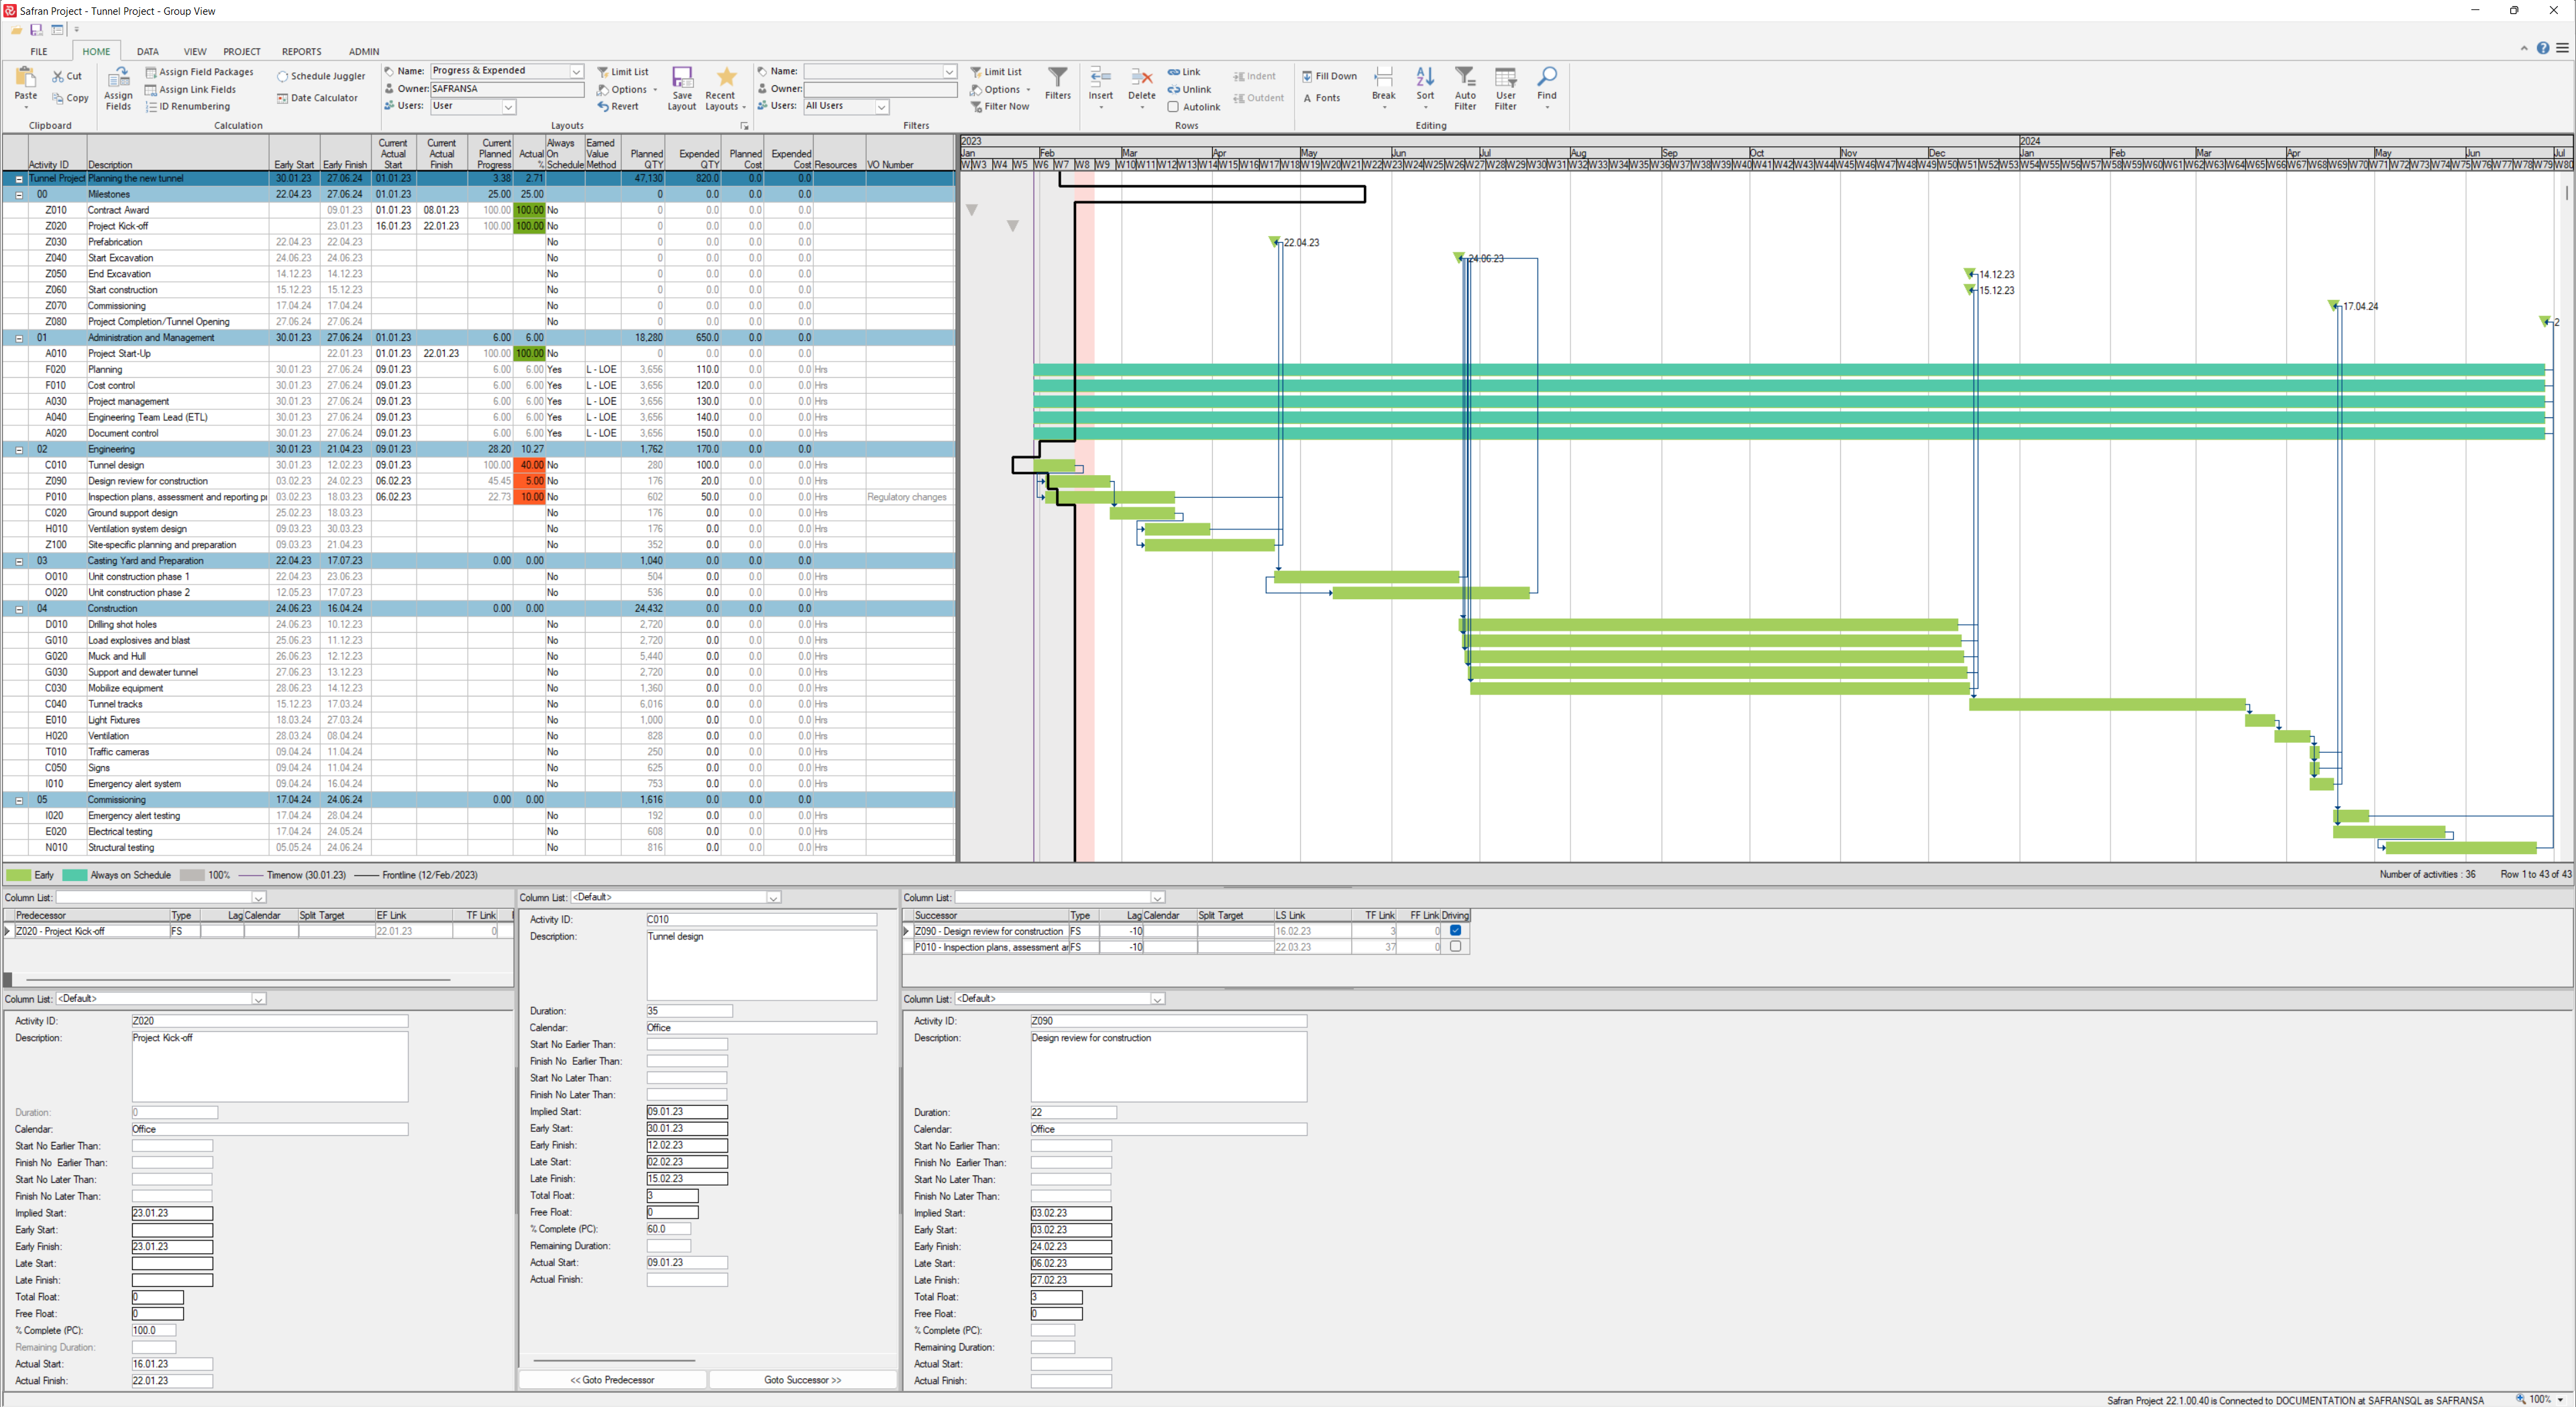
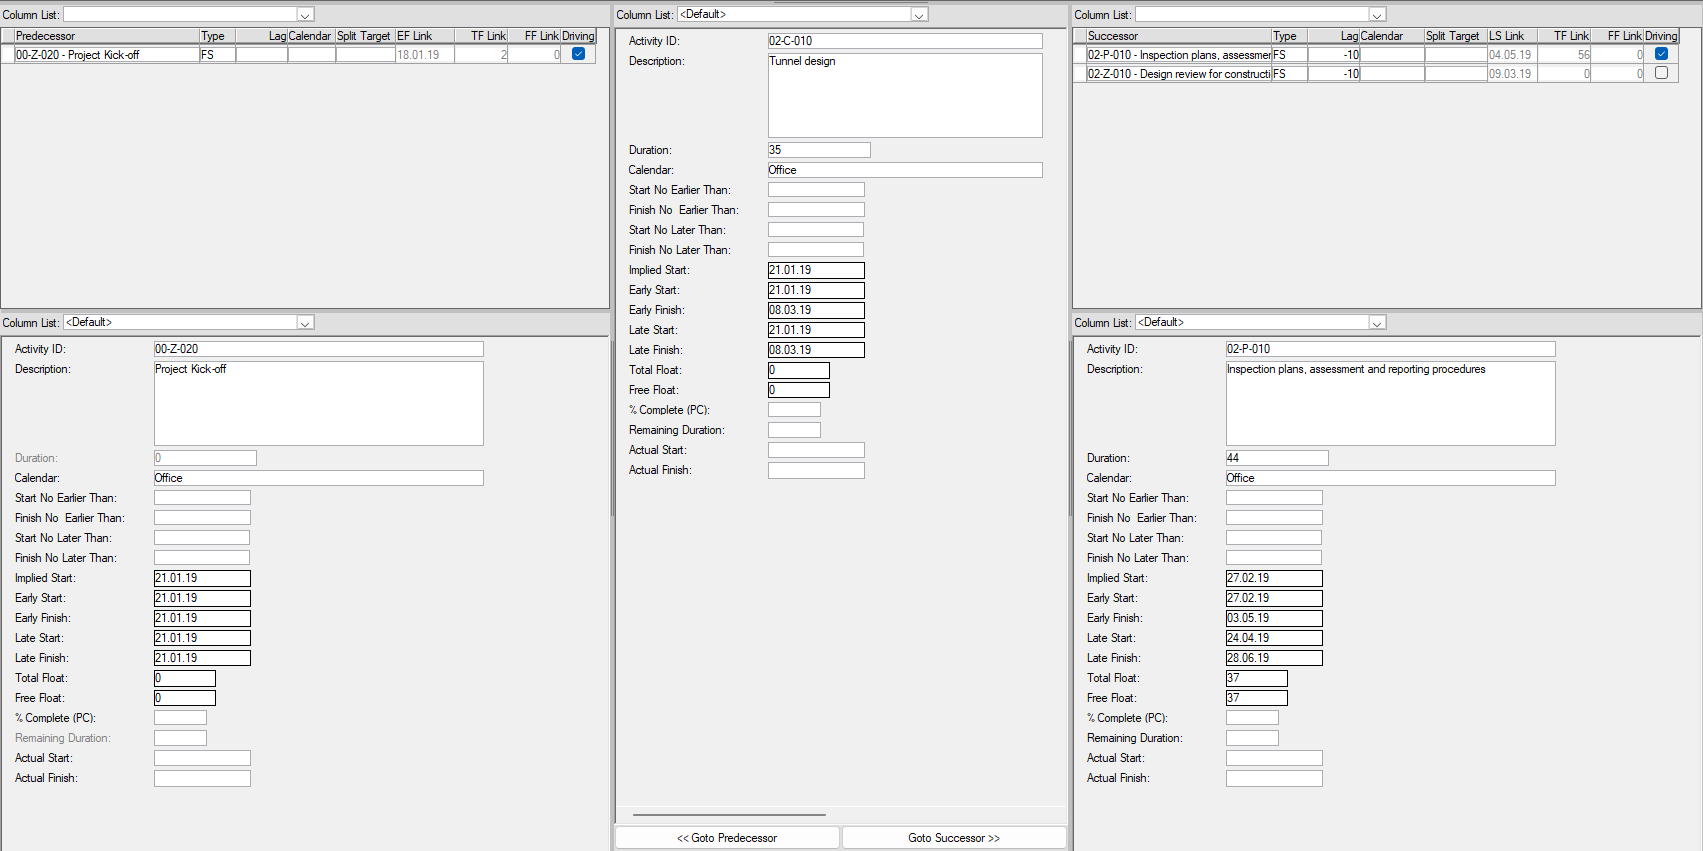
Activity Information
The Activity information panel is a tab-separated window that allows you to view, add, and modify an activity’s information.
| Tab | Description/Data Content |
|---|---|
| *Favorites | Create up to 5 columns in one favorite column list. |
| General | Activity ID, Duration, Calendar, Activity Type and Description data. |
| Constraint/Schedule Options | Start, Finish No Earlier/Later than and Must Start/Finish on date, Must Start on Day, and ALAP constraints. |
| Status | Activity status and scope information. |
| Scheduled | Time analysis results from data-output fields only (cannot be edited or modified). |
| Reference | User Field data: displays defined Reference fields for this project. |
| Text | User Field data: displays defined text fields for this project. |
| Date | User Field data: displays defined date fields for this project. |
| Flag | User Field data: displays defined Flag fields for this project. |
| Decimal | User Field data: displays defined Decimal fields for this project. |
| Duration | User Field data: displays defined Duration fields for this project. |
| Outline Codes | User Field data: displays defined Outline codes for this project. |
| Computed | User Field data: displays defined computed fields for this project. |
| EVM | Use this tab to enter the Earned Value method for measuring completed work. |
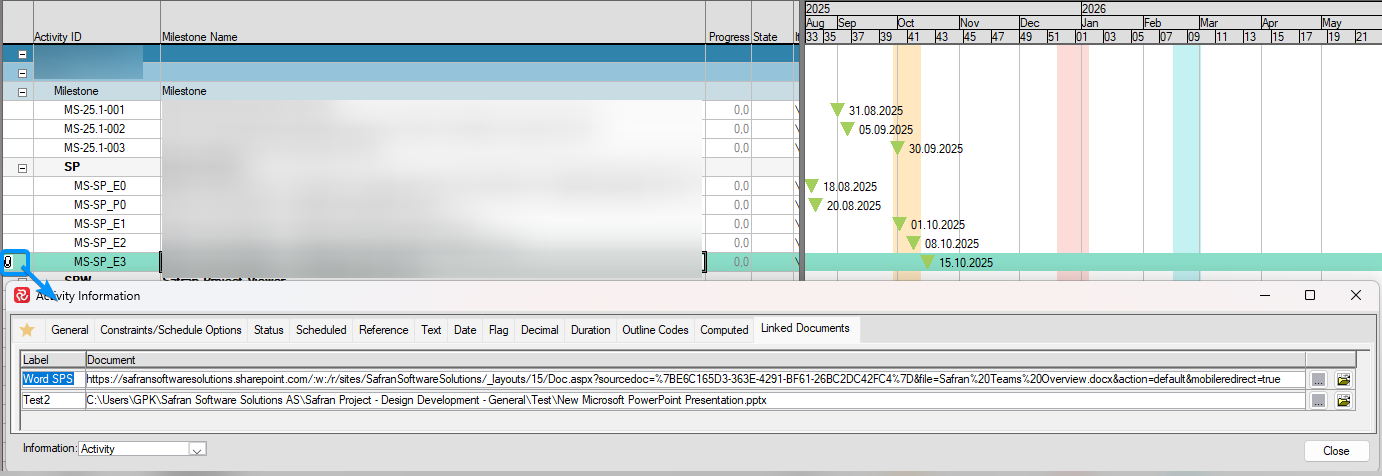
| Linked Documents | List of external documents for activity in focus. |
Constraints/Schedule Options
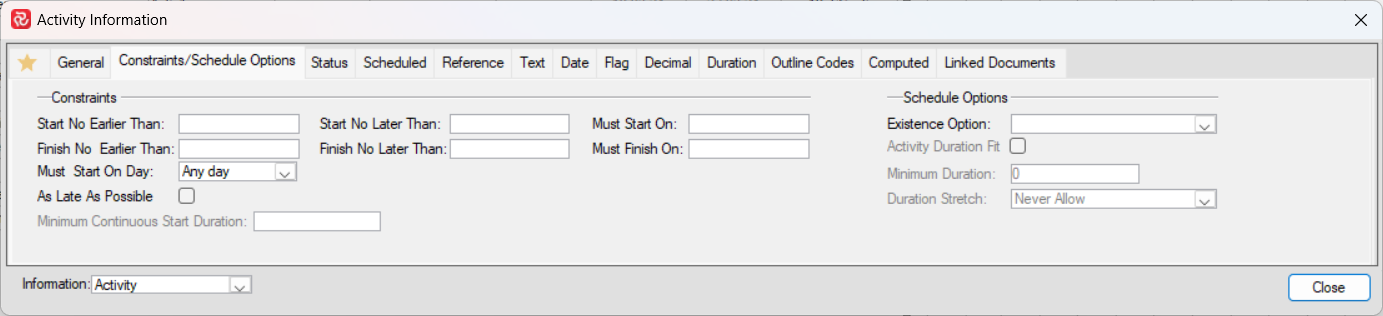
For more information on constraints, see Appendix A.
Status
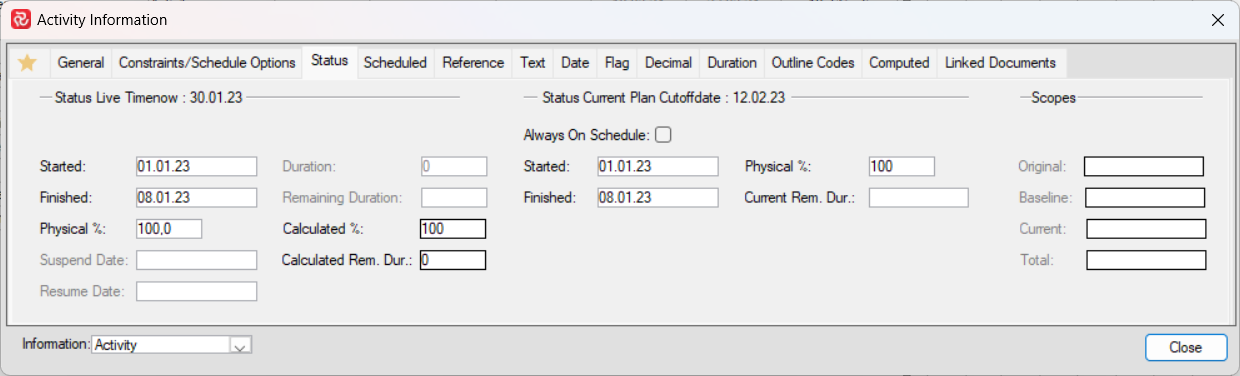
For more information on constraints, see Appendix A.
Scheduled
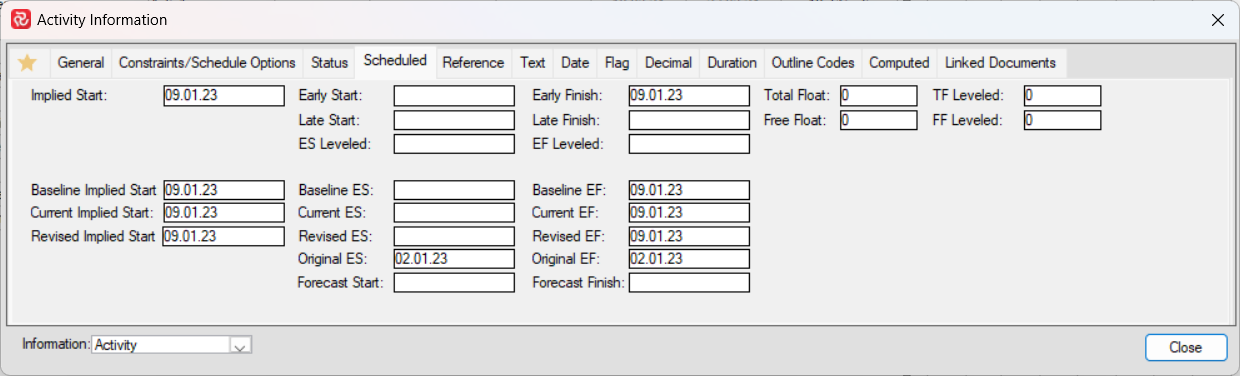
For more information on constraints, see Appendix A.
Linked Documents
Link Information
Safran Project can present predecessor and successor information and the Gantt view. A go-to operation is performed by double-clicking one of the predecessor or successor links. Keep in mind that the requested activity must be included in the selection criteria if this is used.
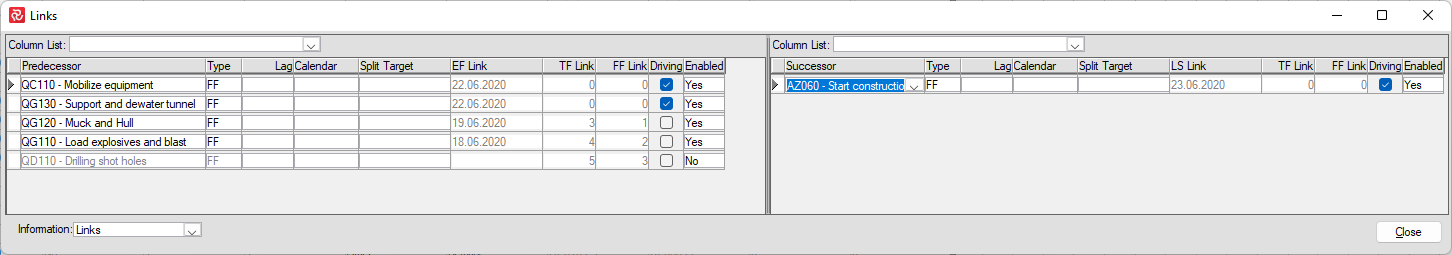
| Tab | Description/data |
|---|---|
| Activity ID | Activity ID for the preceding/succeeding activity. |
| Type | Select the type of link from the drop-down list box. Available types are SS, SF, FS, and FF. The default link type is FS. |
| Lag | A positive lag will delay the start of a succeeding activity. A lag may also be entered as a negative value to support overlap. Lags may also be entered as a percentage. The percentage will be relative to the preceding activity. If multiple predecessors exist, the percentage will be relative to the driving activity. |
| Calendar | Specific Calendar number for link. |
| Split Target | Date to impose a start date on any succeeding activity. Overrides start dates computed by logic. |
| EFC/LSC | Output field - Computed early finish for the preceding link and late start for the succeeding link. |
| TFC – Total Float Link | Output Field - Computed Total Float for the link. |
| Driving | Links that are driving the schedule. |
| Enabled | Enable (Yes) or Disable (No) Links. A disabled link is treated as a deleted link in the schedule. |
Select the Barchart Editor Options window (Project tab > Options) to check if the ‘Use default calendar on new links’ has been marked.
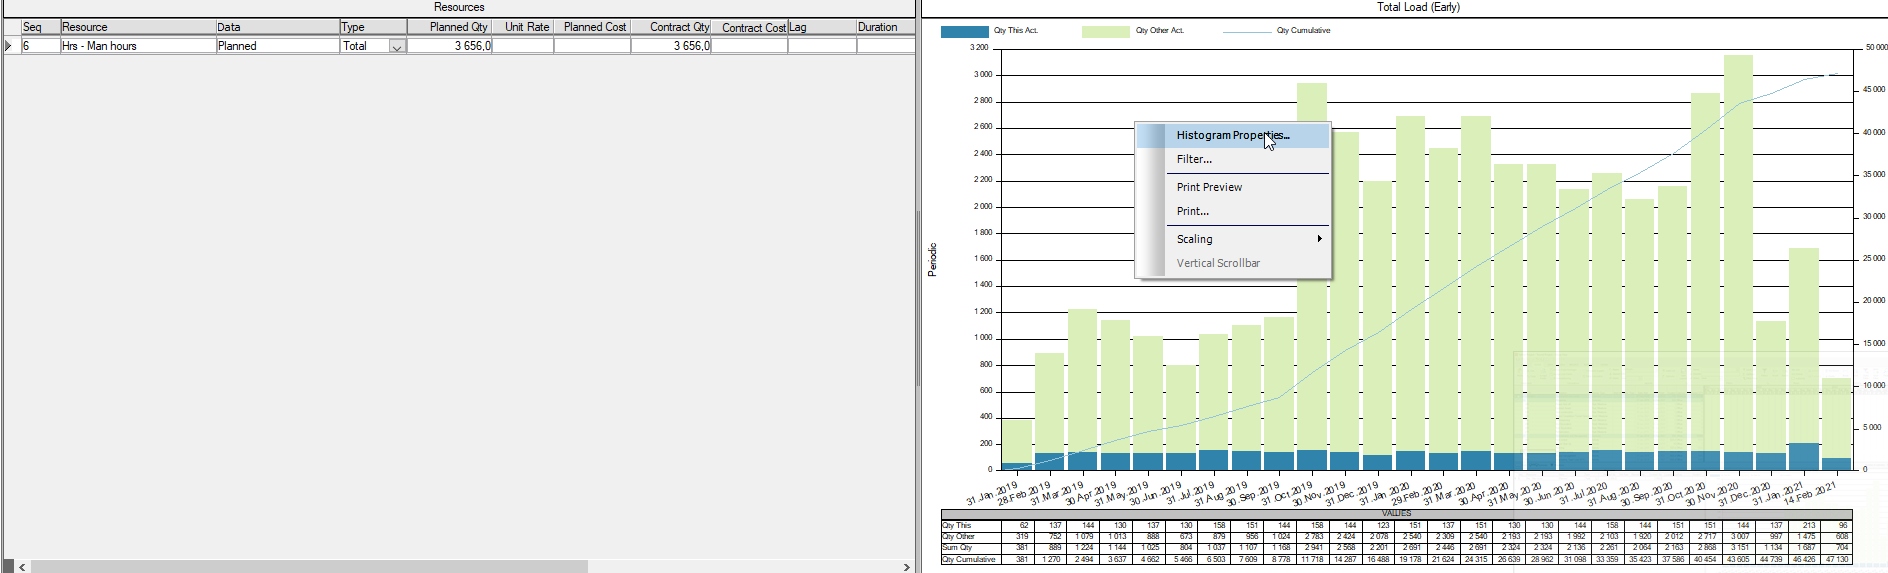
Resources
Displays a two-paned window with resource records for the selected activity on the left and a configurable/dynamic resource histogram on the right. The resource histogram dynamically shows the current resource requirements loading.
The histogram may be configured by choosing Histogram Properties from the shortcut menu to show the entire schedule span, a shorter span by adding user-defined dates, or for a single activity only. You can apply a filter and select to display quantities, cost, or manpower.
Colors and patterns for the various graphic elements may also be selected. You might find rotating the dates and table values helpful if many periods are presented. You may also specify the number of decimals to be displayed for increased accuracy.
Keep in mind that by changing Histogram Properties, the configuration will be valid for all your Barchart Layouts. The changes will, however, not affect the layouts of any other users.
By choosing Print Preview/Print from the short-cut menu, you may also save to file/print a copy of the histogram.
| Resource Fields | Description |
|---|---|
| Type | The type could be either Total or Per Unit. By choosing Total for a quantity resource, you enter the total quantity for that resource. By choosing Per Unit for a quantity resource, you would give the amount for the calendar unit used by the project (Day, Hour, or Minute). Safran Project then calculates the number of units based on the duration of the activity. |
| Planned QTY | Planned resource requirement. |
| Unit Rate | If the selected resource is defined as QTY-related, the Unit Rate field is enabled. The rate defaults to the value specified in the resource definition window, although the user may modify this. For QTY-based resources, the Cost field will be calculated as (Cost = QTY * Unit Rate), while the Contract Cost field will be calculated as (Contract Cost = Contract QTY * Unit Rate). For Cost-based resources, this field is disabled. |
| Planned Cost | For QTY-based resources, this field is disabled for manual modifications but is calculated as (Cost = QTY * Unit Rate). For Cost-based resources, this field may be altered. |
| Delay | Time Delay indicates that the selected resource is not required from the start of the activity but will be delayed by the number of days entered. The 'Delay' may not exceed the 'Activity Duration.' |
| Duration | Resource Duration indicates that the selected resource is not required for the total 'Activity Duration,' only for the duration entered. The value of 'Duration' may not exceed the 'Activity Duration'. 'Duration' may be combined with 'Delay'; The total value of 'Delay' and 'Duration' may not exceed the 'Activity Duration.' |
| Profile | Enter profile for non-linear resource distribution. |
| Calendar | Specify a Calendar for the resource to follow. |
| VO Number | Resource may be connected to change order. Usually an optional field, but mandatory if a project is configured with "Lock Scope." |
| VO Type | If the resource is part of a Change Order/Variation Order, the type of the variation order will be displayed: VO, VOR, Internal Change, or Sub-Contracted. |
| Field | Description |
|---|---|
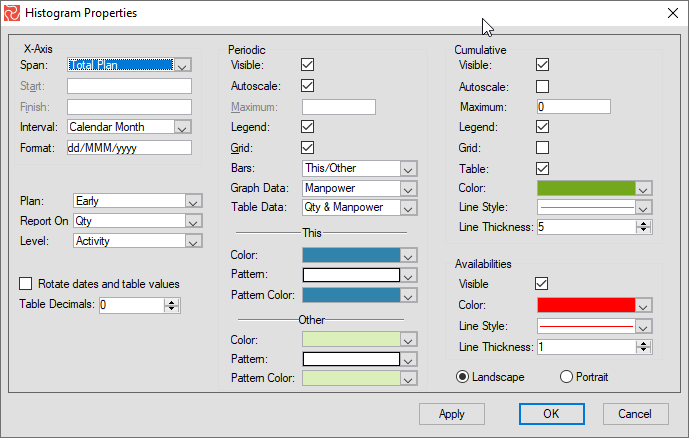
| X-Axis | |
| Span | The Resource Histogram can span the Total Plan, for the selected Activity, or Locked. If locked is used, the Start and Finish fields are enabled, and control the span. |
| It is available when Span is locked. Enter a start date in this field. | |
| Finish | It is available when Span is locked. Enter a finish date in this field. |
| Interval | Select the interval and the period (year, quarter, project month, month, bi-week, week, day) from the drop-down list. |
| Format | Select the date format from the drop-down list. |
| Plan | You can choose if the resource histogram is based on early, late, or levelled dates. |
| Report On | You can choose if the Resource Histogram is based on quantities or cost. |
| Level | You choose if the resources should be displayed on the activity level on a reference field or text field. |
| Rotate dates and table values | Tick this checkbox if you want the date/text to be rotated 90 degrees to the left. |
| Table Decimals | Number of decimals displayed in the table section of the report |
| Periodic | |
| Visible | Tick the checkbox to display periodic values in the resource histogram. |
| Autoscale | Tick the checkbox if you want to scale the bar height automatically. When moving between activities, the same bar height will represent different values. Removing this tick enables the maximum field. |
| Maximum | This is only available if Autoscale is unchecked—the histogram's maximum value of the periodic Y-axis. The same bar height for different activities will represent the same value. |
| Legend | Tick this checkbox to make the legend visible. |
| Grid | Tick this checkbox to make grid lines according to the values on the periodic Y-axis. |
| Bars | You can choose between This/Other and Sum. The This/Other option will stack the bar using different colors. One color represents your selection in the field Level, and another represents other work simultaneously. The Sum option summarizes the This and Other values and displays the bar using just one color. |
| Graph Data | If you have selected quantities in the Report On field, you can choose whether the graph is based on quantities or manpower. If you have set Report On, you may display graph data based on Cost or Cost Per Day. |
| Table Data | If your Report On selection is quantities, you choose whether the table values are based on quantities, manpower, both, or none. If your Report On selection is Cost, you may choose to display table values as cost, cost per day, both, or none. |
| This | |
| Color | Select the color to visually represent the selected activity for the graph bars from the drop-down list. |
| Pattern | Select the pattern type from the drop-down list to visually represent the selected activity for the histogram bars. |
| Pattern Color | Select the pattern color from the drop-down list to visually represent the selected activity for the histogram bars. |
| Other | |
| Color | Select the color to visually represent the other activities for the graph bars from the drop-down list. |
| Pattern | Select the pattern type from the drop-down list to visually represent the other activities for the histogram bars. |
| Pattern Color | Select the pattern color from the drop-down list to visually represent the other activities for the histogram bars. |
| Cumulative | |
| Visible | Tick the checkbox to display cumulative values in the resource histogram. |
| Autoscale | Tick the checkbox if you want to scale the line height automatically. When moving between activities, the same line height represents different values. Removing this tick enables the maximum field. |
| Maximum | This is only available if Autoscale is unchecked—the histogram's maximum value of the cumulative Y-axis. The same line height for different activities represents the same value. |
| Legend | Tick this checkbox to make the legend visible. |
| Grid | Tick this checkbox to make grid lines according to the values on the cumulative Y-axis. |
| Table | Tick this checkbox to make cumulative values visible in the Resource Histogram table. |
| Color | Select the color for the line graph from the drop-down list |
| Line Style | Select if the line graph should be continuous or dotted. |
| Line Thickness | Select the line thickness for the cumulative line when printing the Resource Histogram on paper. |
| Availabilities | |
| Visible | Tick the checkbox to draw a line based on the resource availability values. |
| Color | Select the color for the line graph from the drop-down list |
| Line Style | Select if the line graph should be continuous or dotted. |
| Line Thickness | Select the line thickness for the resource availability line when printing the Resource Histogram on paper. |
| Landscape Portrait | Choose if the Resource Histogram should be printed in landscape or portrait mode. |
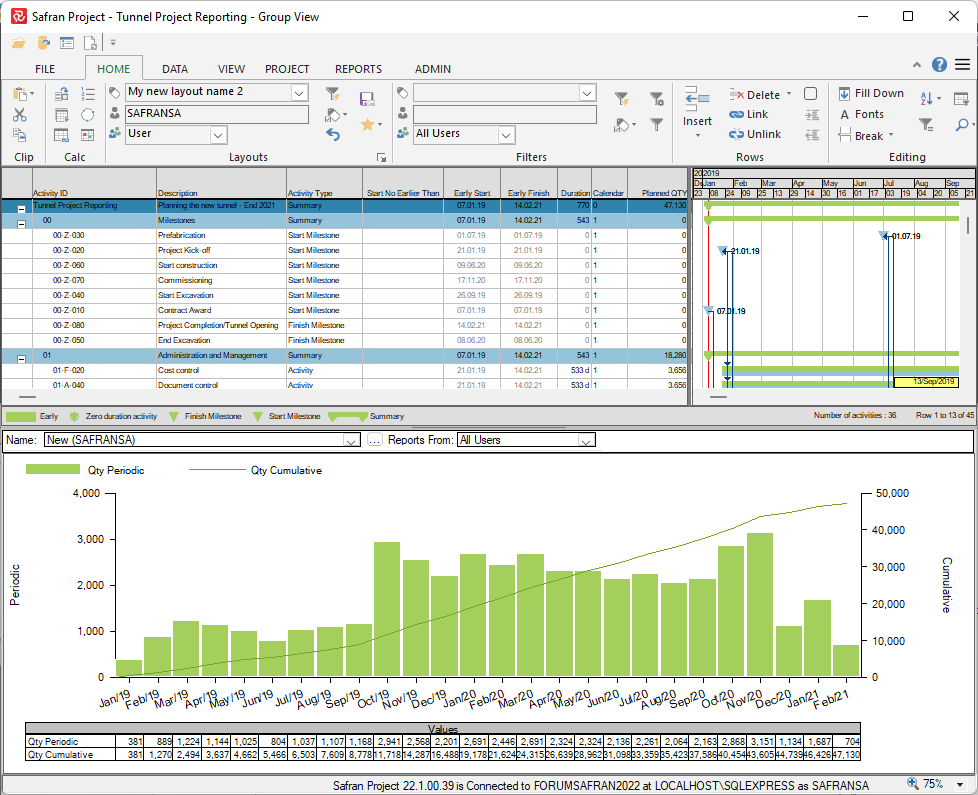
Displaying the User-Configurable Histogram
If you select VIEW>Histogram, Safran provides a flexible and configurable histogram in the lower pane. The histogram view gives you more flexibility to customize and prepare striking presentation graphs.
You cannot use the Histogram pane for data entry. It is an interactive, graphical view of periodic and cumulative data. For printed output, the histogram includes page setup features similar to the Barchart Editor page setup.
As such, it is a powerful reporting tool. You can save your definitions as unique report names for later use. The histogram graphs also let you create curves and bars for numerical values other than quantity or cost. This allows you to create histograms and curves from user-defined data.
Details on configuring and customizing the Barchart Editor Histogram can be found in the Barchart Editor Histograms and S-Curves section.
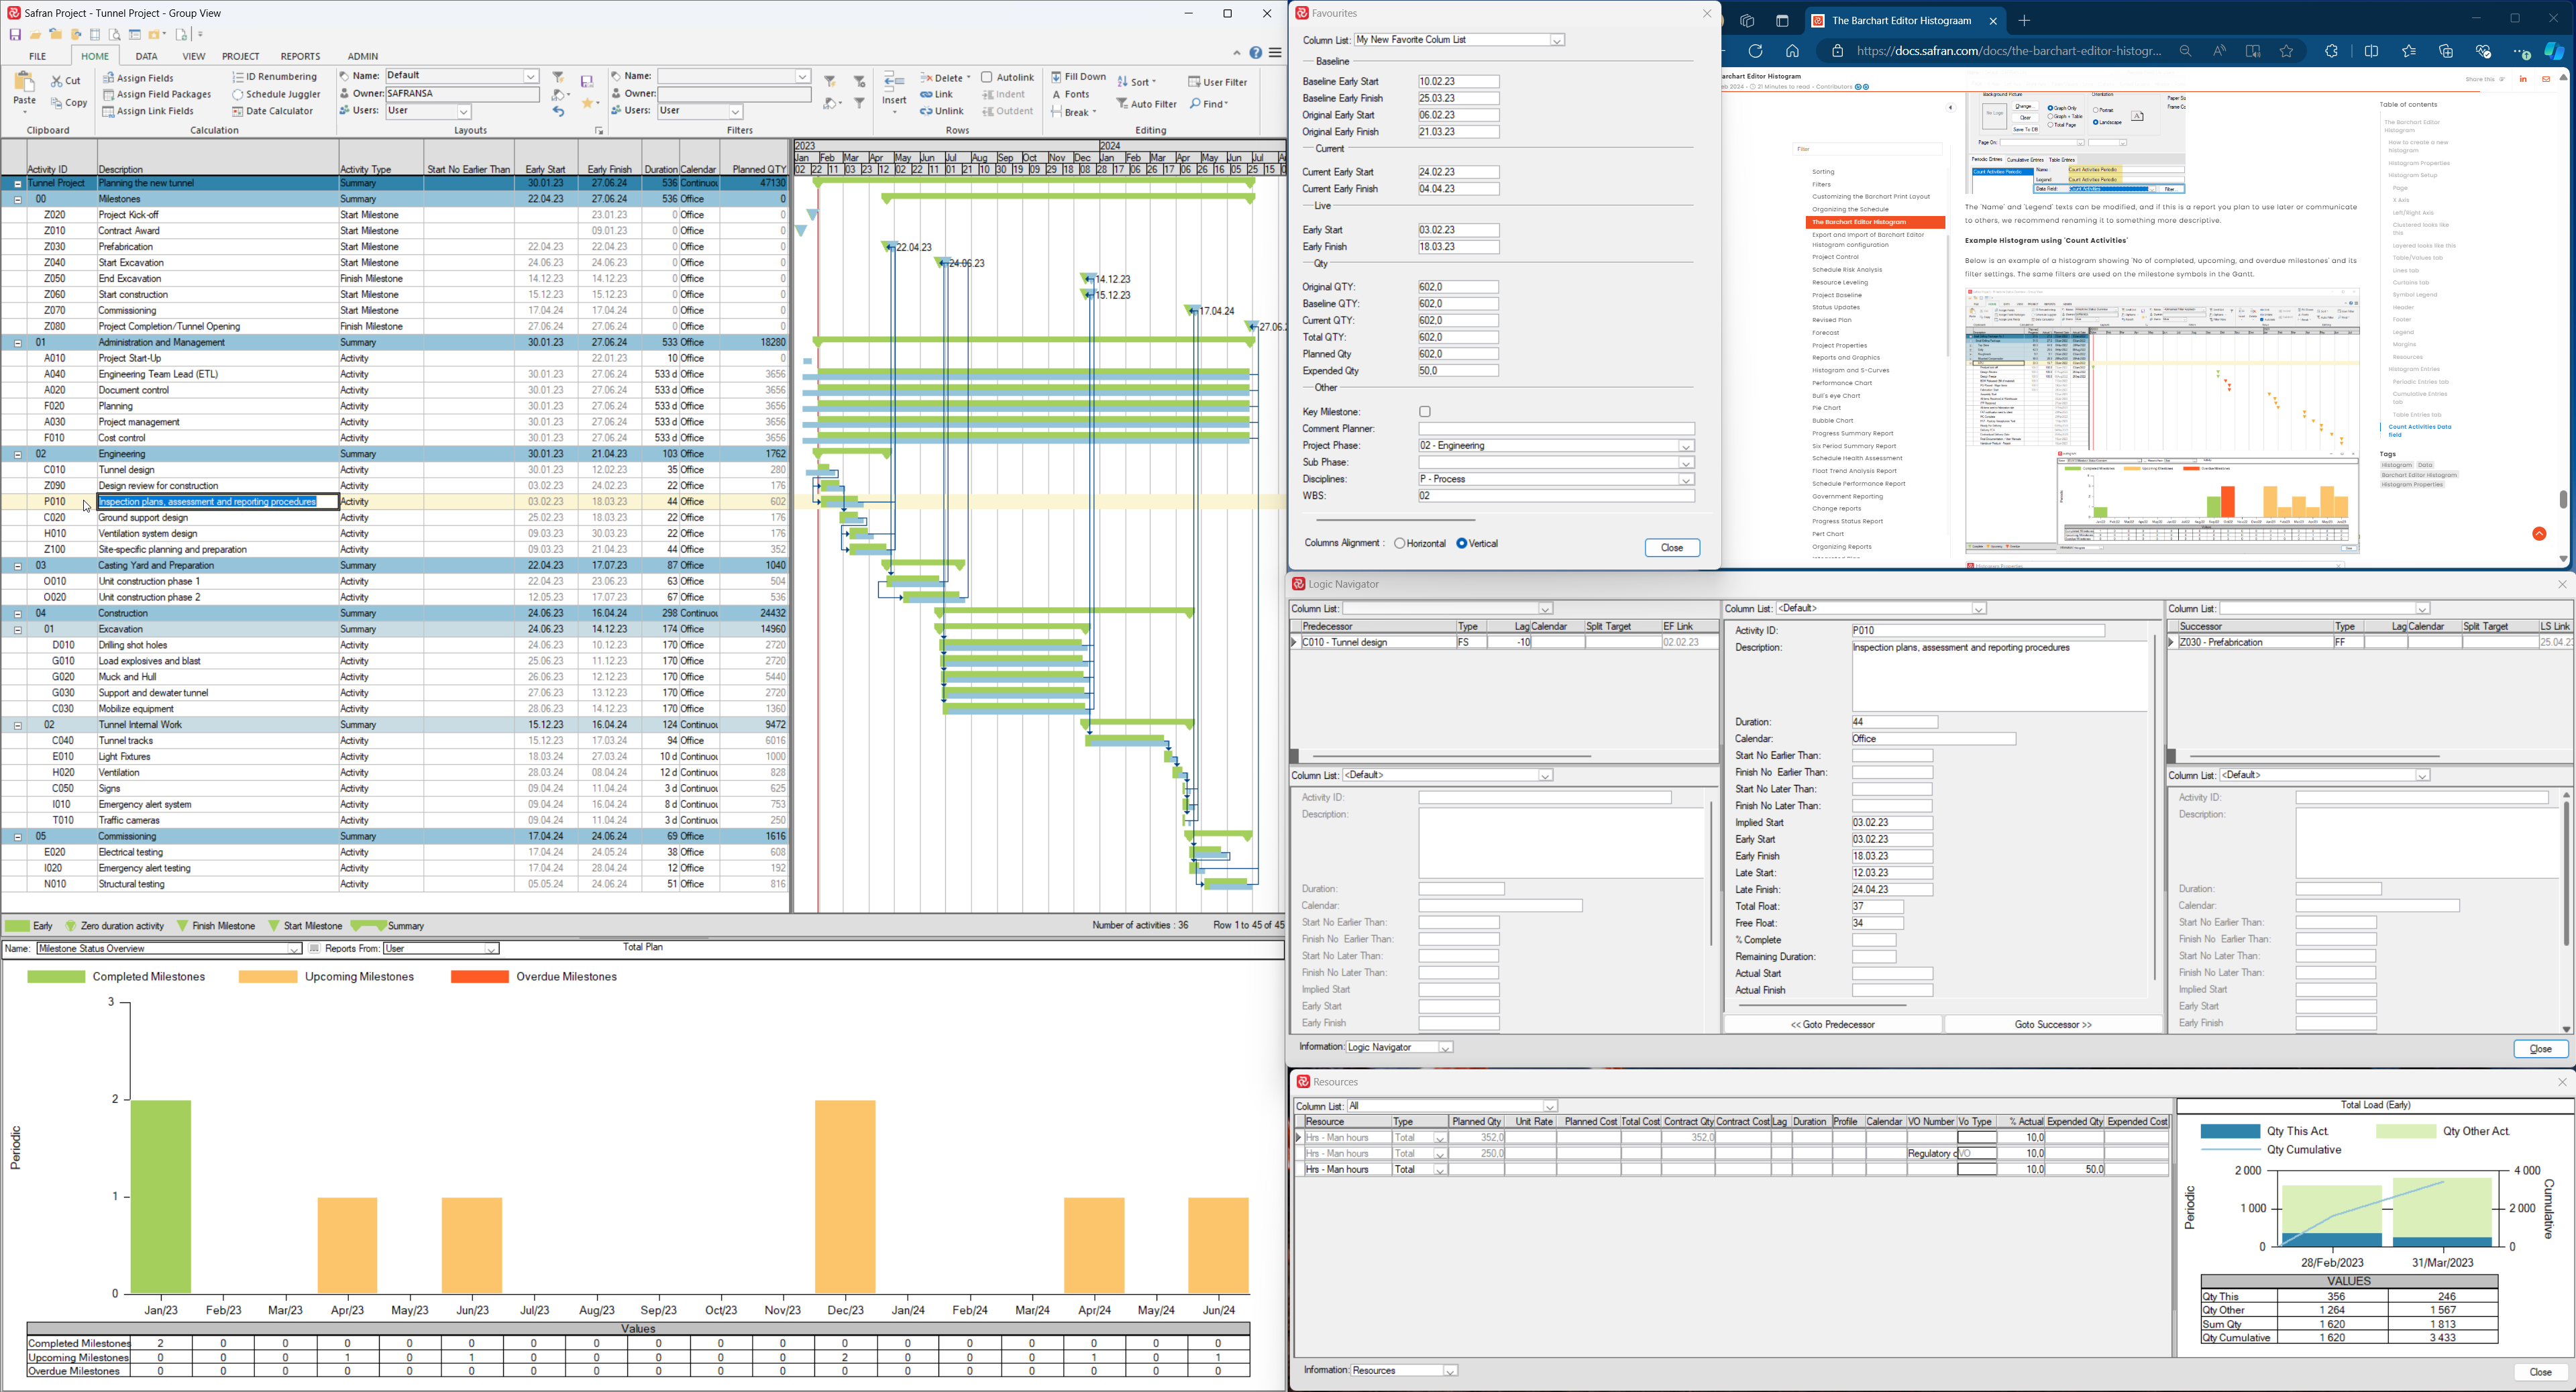
Logic Navigator
Logic Navigator is an efficient way to review your activity data, especially for the project logic. This option allows you to scan through a logic path in either direction or directly to a specific activity and display all proceeding and succeeding relationships.
You can add and delete relationships. As you work with the logic navigator, Safran Project runs a complete CPM time analysis on your project following every change.
The Logic Navigator panel comprises a central activity window and two multi-predecessor/ successor windows. The screen presents an activity and all of its preceding and succeeding activities.
The predecessor/successor schedule data displayed pertains to the uppermost activity in the window; schedule data for the other links (if any) may be indicated by clicking the arrow on the activity in question.
If more than one predecessor/successor exists for an activity, the preceding/succeeding activity displayed is, by default, the uppermost in the window. Navigating any linked activities, either predecessors or successors, is done by double-clicking the activity in the appropriate view.
Start Browsing from any Activity.
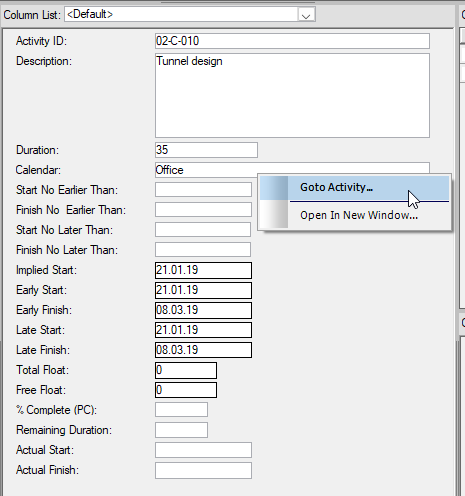
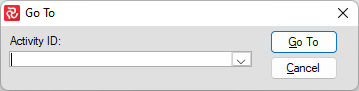
Using the Go to Activity option in the activity shortcut menu, you may jump straight to any activity in your plan to view the activity or start browsing in any direction from the activity selected. Enter the Activity ID or choose from the drop-down list box.
Tracing Logic
You can examine any path, a sequence of activities, by moving forward or backward through the schedule. Move from an activity to its successor, then to its successor, or move from an activity to its predecessor, then to its predecessor.
You can use the Barchart Editor or Logic Navigator to scan through the project logic, go directly to a specific activity, and display all preceding and succeeding relationships.
You move from one activity to the next simply by double-clicking the activity in the predecessor or successor window of the Logic Navigator or the Link Information View of the Barchart Editor.
Adding Logic Using the Logic Navigator
Define relationships in the Logic Navigator by choosing either the new Predecessor or New Successor option. The options are available in shortcut menus in both predecessors and successors. Safran Project gives you identical windows for assigning logic in the Barchart Editor’s Link Information View.
Removing Logic Using the Logic Navigator
Select the activity logic you want to remove from the Predecessor or Successor windows, and then select the delete option from the shortcut menu. Safran will give you a delete warning before deleting the logic.
Column Lists in Information Panes
Safran Project allows you to save your own personal 'Column Lists' that your user may use on any layout in the database.
Column lists are available in:
- Resource Information
- Link Information
- Logic Navigator
- Activity Information Favorites Tab
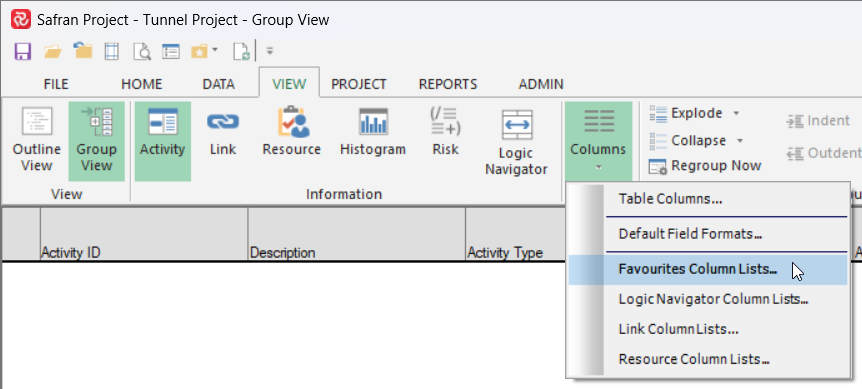
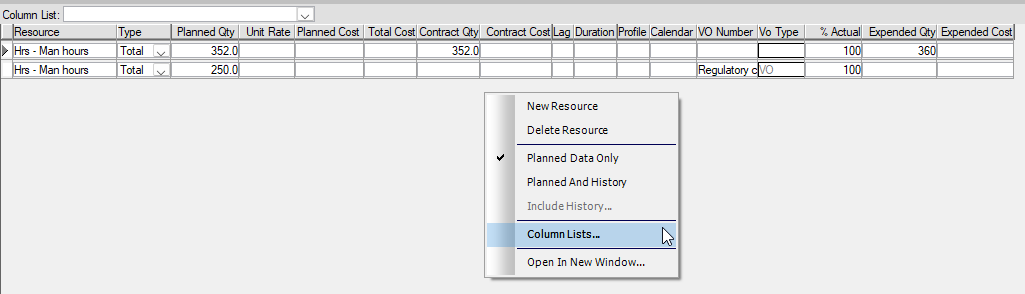
The Lists can be accessed by right-clicking in the relevant information panel, or through the Columns icon on the VIEW Ribbon:
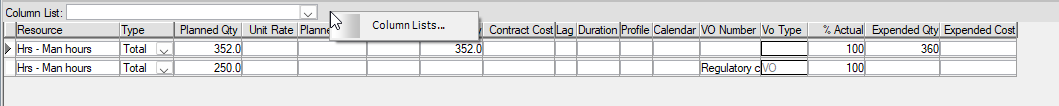
Resource Information Column Lists
The default list contains all available fields:

To create and modify your lists, use the quick access shortcut (right-click) when standing in the resource information.
You may access the list from two places in the information panel:
1:
2:
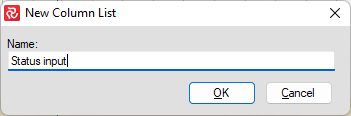
To create a new list, click 'New' and give it a name:
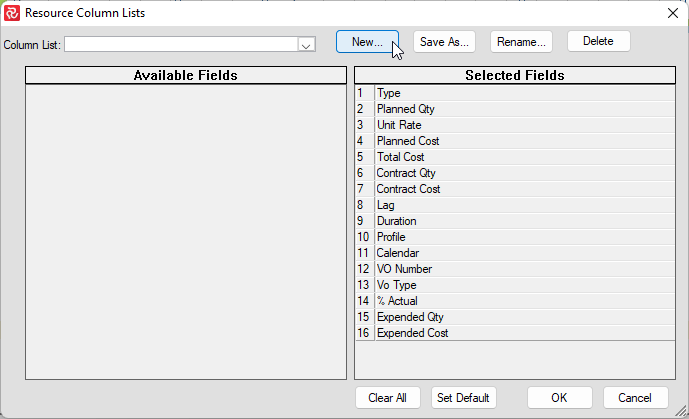
Drag and drop the columns you do not need in your new Column List from right to left and press OK.
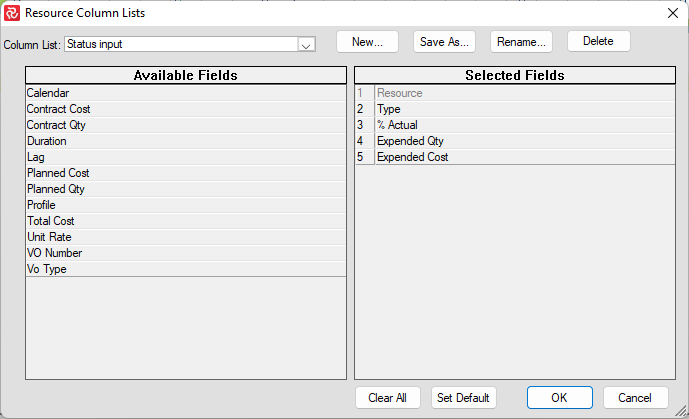
Below, you see a few examples of lists that you may create for your usage:
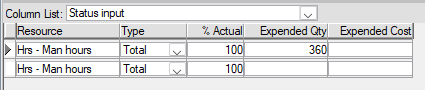
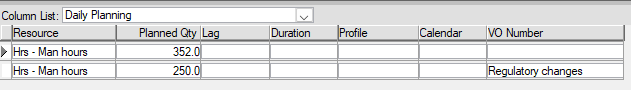
Notice that the column width is saved with each Column List.
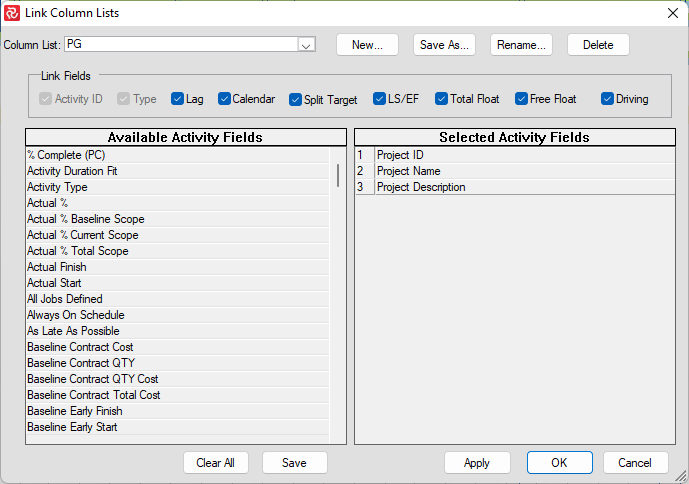
Link Information Column Lists
These column lists are created and modified like the Resource Information Column Lists described earlier.
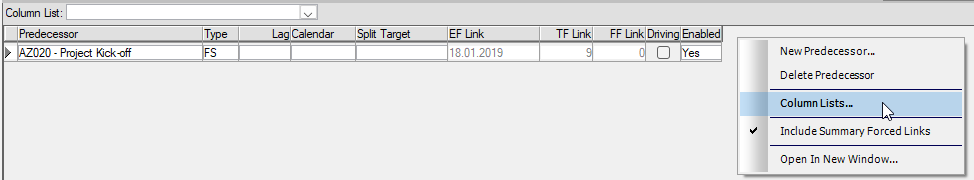
The only difference, besides the content, is that the default columns you tick and untick on top (ref. blue square below), while if you would like any extra columns, you drag and drop from left to right:
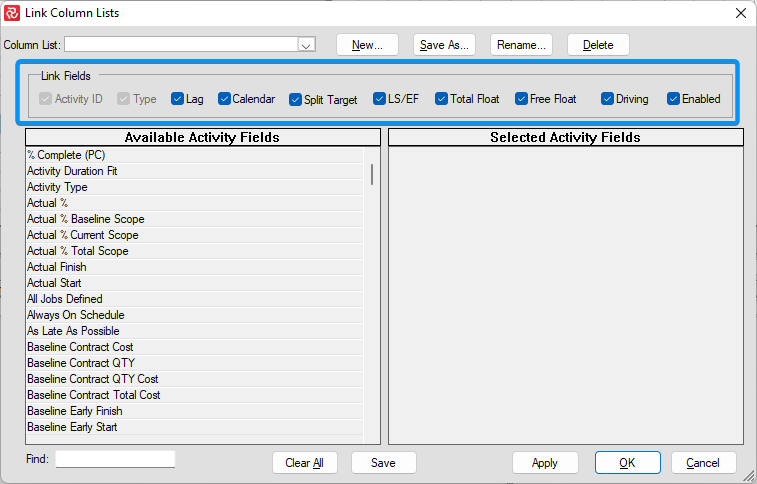
If you are working with Project Groups and interface links, these fields might be of interest:

Notice that you may use two different column lists on your Predecessor and Successor list:

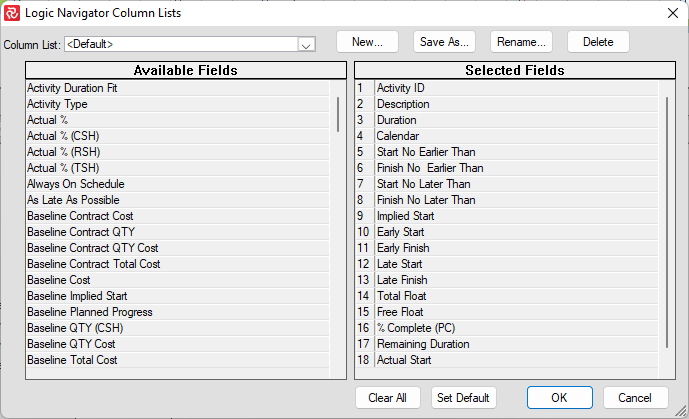
Link Logic Navigator Column Lists
These column lists are created and modified like the Resource Information Column Lists described earlier.
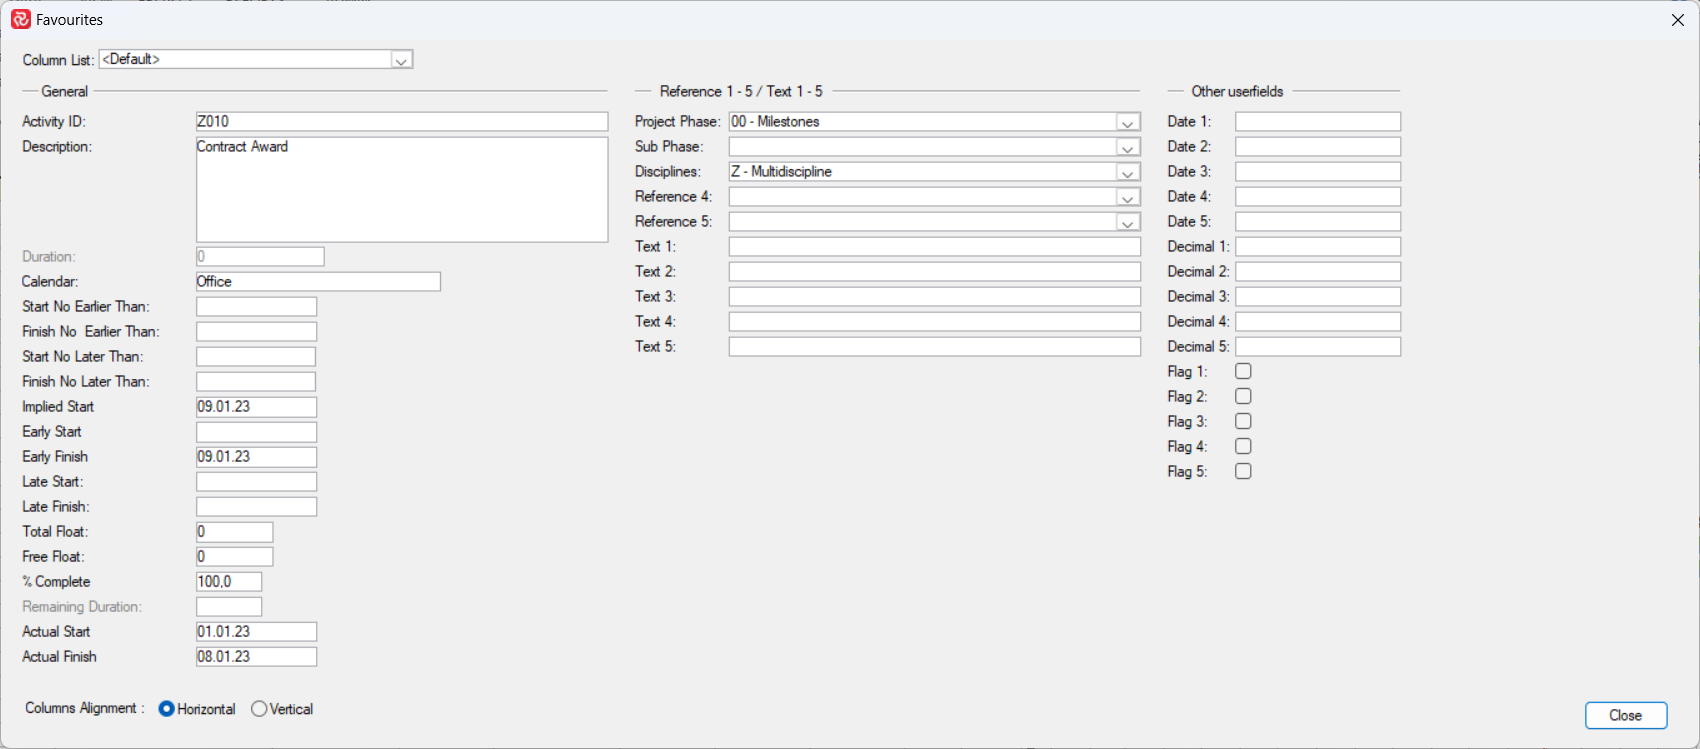
Favorite Column Lists
These column lists are created and modified similarly to the Resource Information Column Lists described earlier.
The Default column list contains 3 columns:
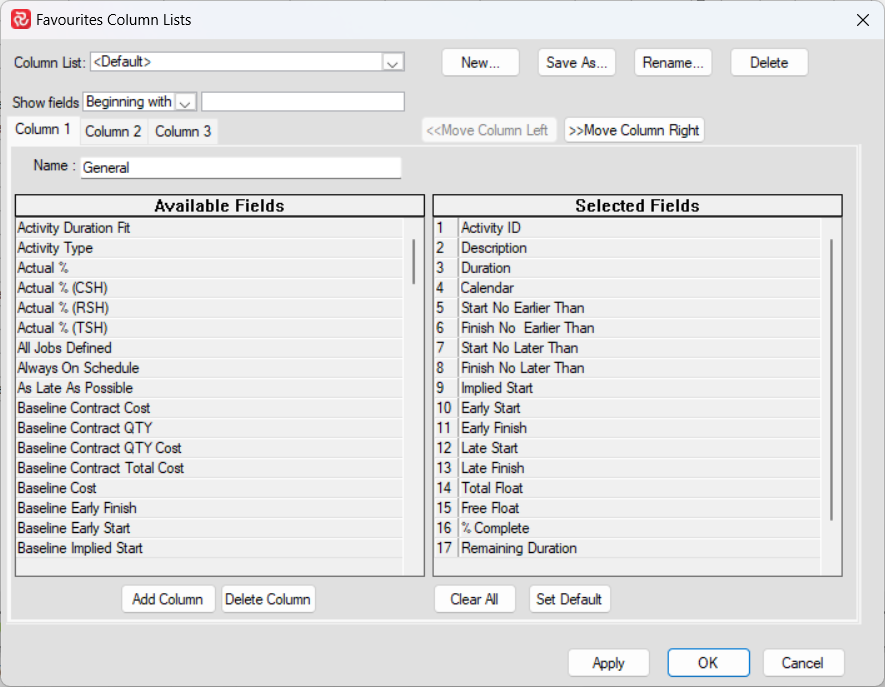
It is possible to add up to 5 columns in one column list. All column headings can by modified and it is also possible to Move Columns to the left and right.
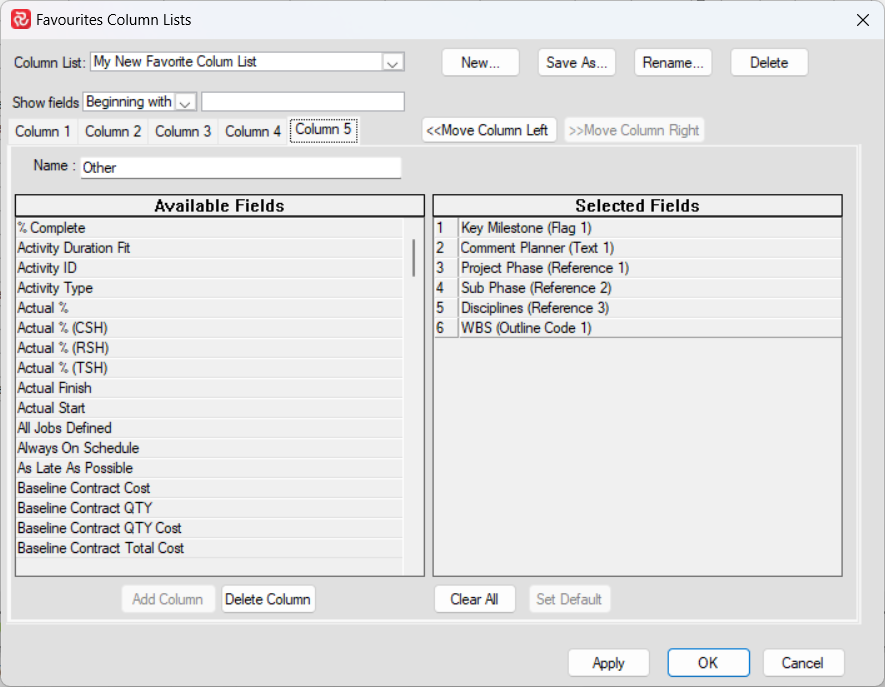
If you are looking for a Reference field but you cannot remember the name, simly write (Ref and the list will show only Reference fields which has values in the opened Project.

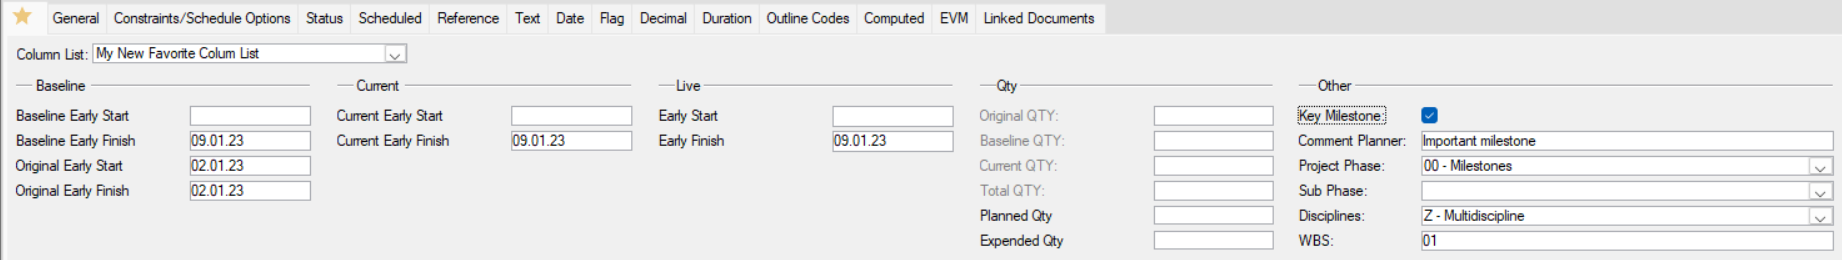
This is how the Column List above with 5 columns will look like when used in the Activity Information Panel:
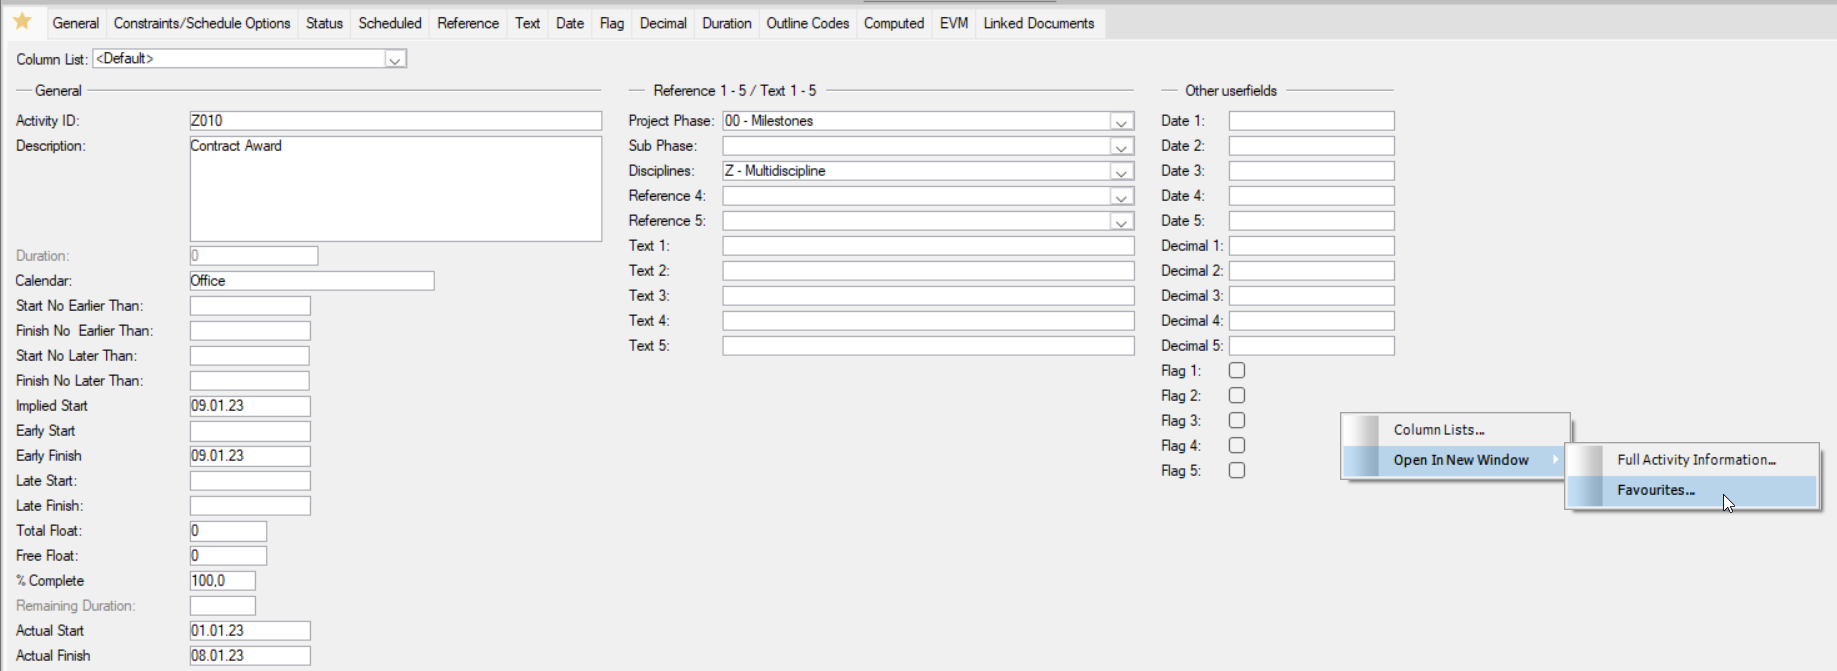
Favorite Column List can be opened in a new window both Horizontally and vertically by using the right-click short cut and choose Open in New Window/Favorites. Safran Project will remember the last setting (horizontal/vertical). The shortcut key is Ctrl + Shift + O.
Horizontal View:
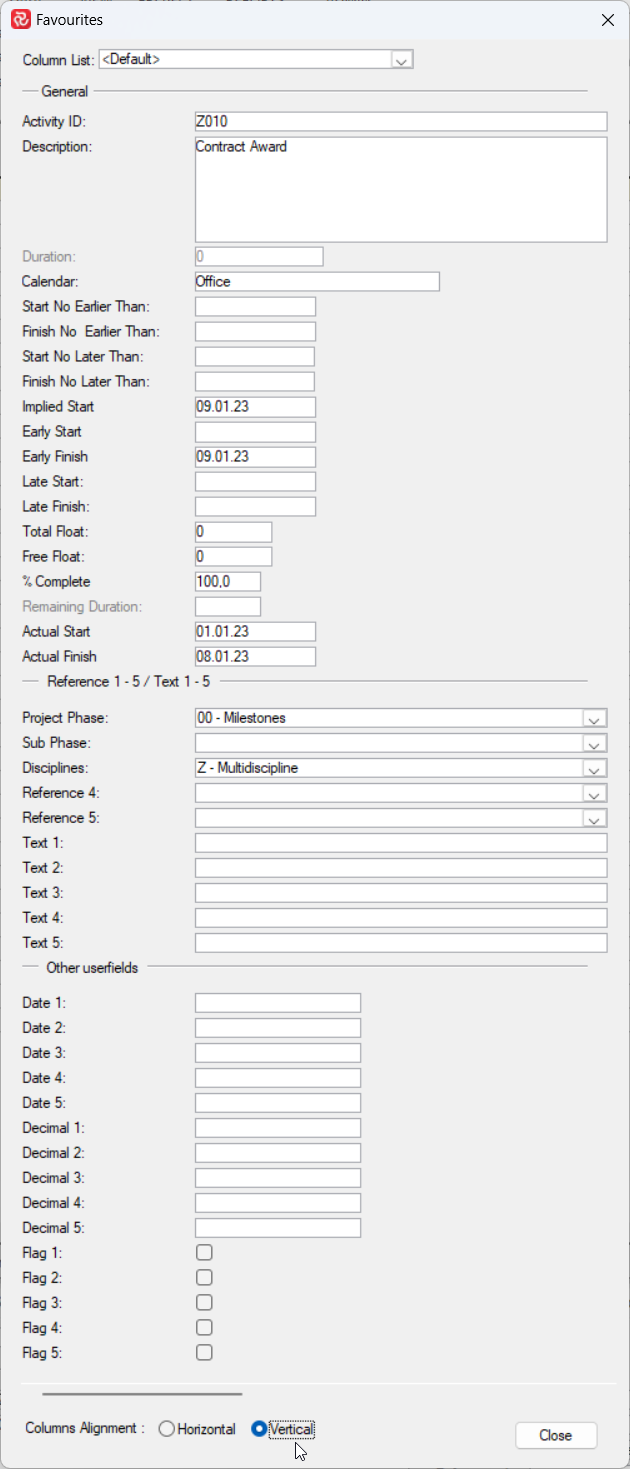
Vertical View:
You can have all Column Lists open at the same time while working in the Barchart Editor