Correlation
Risks do not always occur independently of each other. When one risk occurs, the likelihood or impact of another might be higher or lower. This is modelled in Safran Risk using a correlation matrix.
The Correlation Matrix
The correlation matrix offers a practical way to correlate the probabilities and impacts of different risk factors. This can often be an essential tool in order to model risks accurately. In this matrix, you can specify the correlation between all risk factors that you have identified for your project (The exception are the risks which impact independently. Since they can represent many independent risk events, they cannot be correlated to other risks).
A risk is modelled using a number of probabilistic distributions (one for probability and one for each impact). The correlation between two distributions describes the dependence between them (and implicitly the dependence between the risks) on a scale from -1 to 1. The correlation of a distribution with itself is conventionally considered as 1. A value of 0 means that the distributions are independent of each other.
The correlation matrix is used to describe a statistical dependency between two or more input distributions. It has a row and a column for each probability and impact that has been defined for the project.
When you enter a number between -1 and 1 in the matrix you’re creating a dependency between two distributions. If for example experience tells us that when a mechanical breakdown occurs, a fire is more likely, this can be modelled. It is done by entering a positive value in the correlation matrix at the cross section of Mechanical Breakdown probability and Fire probability.
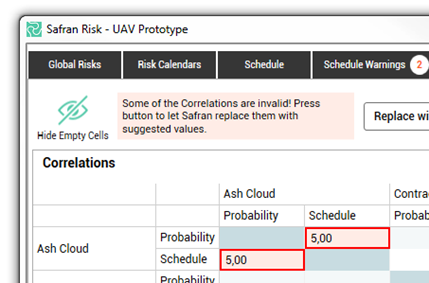
Inconsistent Matrix
Keep in mind that the matrix has to be consistent! For example, when having a relationship between distributions A and B, and another relationship between B and C, we should have a relationship between A and C as well, so all three are consistent.
If you, for any reason, type a value that results in an inconsistent matrix, you will get a warning. You can fix the inconsistency manually by changing the values in the matrix (recommended) or let Safran Risk replace them with values that result in a valid matrix. If the matrix is in an inconsistent state, you will not be able to run the risk analysis with correlation. You can however leave the matrix in an inconsistent state and fix it at a later time.
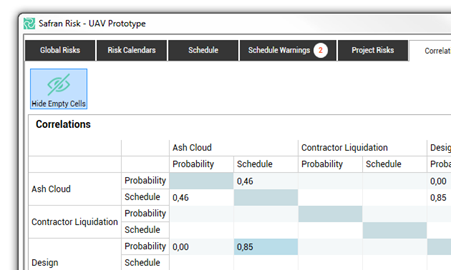
In order to get the most efficient use of your table, Safran Risk allows you to see only the risk factors with values in the matrix. To do so, simply click on ‘Hide Empty Cells’ icon.
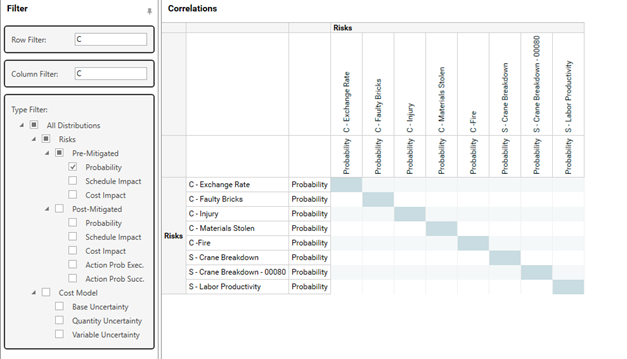
Filtering the Correlation Matrix
A risk model can grow quickly and contain hundreds of distributions. This will lead to a very big risk matrix. To easily find the distributions you want to correlate you can take advantage of the filers in the left part of the screen.
The first two filters, Row Filter and Column Filter, lets you enter a free text. It filters out all distributions that do not contain this text.
The third filter lets you pick the type of distributions you are interested in.
If you for example only want to see probability distributions for risks that contains “C” you can set up the filter like this:
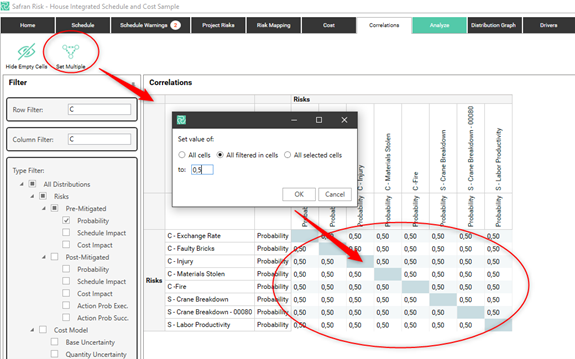
Set Multiple
Sometimes you want to correlate a whole group of correlations with the same correlation coefficient. To make this easier there is a function called “Set Multiple” in the correlation matrix. “Set multiple” allows you to set all cells, all filterd in cells, or all selected cells to the same value.