Drivers
It is of great importance to clarify what Risk Drivers mean in Safran terminology. Within our project plan, we identify risks, assign them to the related activities and calculate their impacts. As we have already seen, a project activity may be affected by one or more risk impacts.
We can define risk drivers as the elements (or factors /causes), which may lead to different project outcomes than those we have planned.
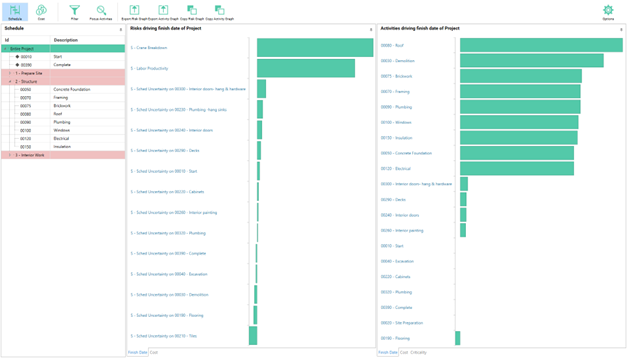
Safran Risk provides a list of project finish and project cost risk drivers on the left-hand side and activity project finish and cost drivers on the right-hand side.
The risk drivers are ranked by those risks that, during the simulations, were most tightly correlated to either delays in the project finish or overspends in the project cost.
Similarly, the activity drivers are ranked by those activities that, during the simulations, were most tightly correlated to either delays in the project finish or overspends in the project cost.
In the presented tornado charts, you can right-click on the label and you can select to be redirected to the corresponding element(e.g. Risk, activity or cost element).
By selecting an element (e.g. an activity) in the tree to the left you can look at what’s driving that element instead of the entire project.
For activities you can see a tornado called Criticality. This shows how often the activities are on the critical path.
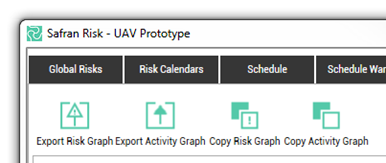
Any of the graphs you choose can be exported as an image by clicking either of the two export icons in the ribbon. Images can be copied to the clipboard or saved as a ‘.PNG’ image file.
Driver Options
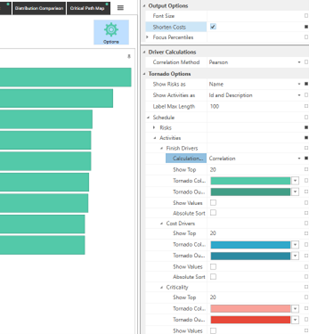
There’s a number of Options in the drivers tab that lets you choose how the values are calculated and what the tornados should look like.
Driver Calculations
Here you can select the correlation calculation method. Either Spearman or Pearson.
Tornado Options
In here you can choose what the graphs should look like and how many risks and activities that should be included.
For activities you can select the method for calculating the drivers. The options are:
| Method | |
|---|---|
| Correlation | Standard correlation calculation using either Pearson or Spearman. |
| Correlations x Criticality | By using this you can “filter out” the activities that are never on the critical path. |
| Schedule Sensitivity Index | This can only be used for seeing the drivers of the entire project. It’s calculated using the following formula: SSI = (StDevActivityDuration * CI) / StDevProjectDuration |