Sensitivity Analysis
The drivers report allows you to identify which risks are responsible for delaying the project completion or causing cost overruns. Sensitivity analysis takes this a step further by providing you with detailed information on precisely how much of an effect these risks have in term of days and/or cost units.
In order to run the sensitivity analysis simply click on the ‘Calculate Impacts’ button and Safran will initiate the analysis.
The Single Pass method
When running using the default ‘Single Pass’ method, the sensitivity analysis will perform an initial run with all the risks included. The included risks are the ones selected in the Analyze tab. It will then systematically re-run the entire analysis excluding one risk at a time to allow it to gather specific information on the impacts of each individual risk.
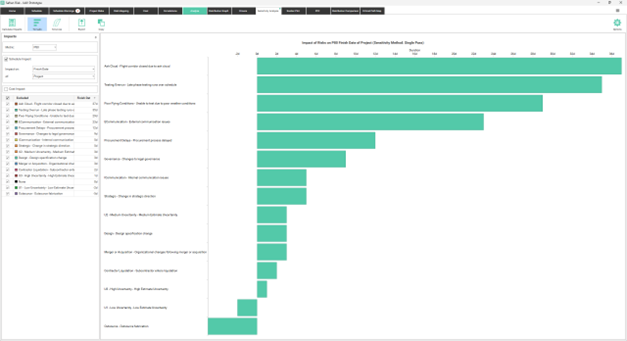
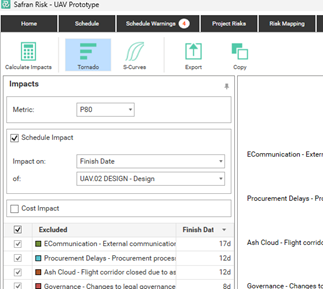
When the analysis has completed Safran shows the results for each risk. The Impacts pane lists all the risks, initially sorted by schedule impact. The tornado chart shows you the same numbers as the table. The S-Curves pane shows all the corresponding curves for these risks, color-coded according to the color of the risk.
Any of the risks can be hidden or shown by clicking the corresponding checkbox in the Impacts pane. You can also select or deselect all risks by ticking on or off the box on the left hand side of Excluded field. The checkbox states affect what’s being shown in the Tornado and S-Curves charts.
Safran Risk provides an instant visualization of the different risk impacts at any selected metric (the available percentiles are the focus percentiles). To view the impact each risk has to the schedule at different confidence simply change the selected metric in the impacts pane. The values for the updated metric are immediately visible in both the Impacts pane and the tornado and S-Curves chart.
If you’ve selected one or more Focus Activities in the Analyze tab, you can also see how much a risk impacts an activity or summary. You do this by selecting one of your focus activities in the dropdown in the impacts pane. Note that if you add more focus activities you have to re-run the sensitivity analysis to see the new focus activities in the drop down.
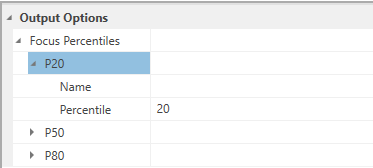
To change the percentiles, you go to Focus Percentiles in the Options pane.
The Multiple Passes method
As well as the default ‘Single Pass’ method, sensitivity analysis can also be run using the ‘Multiple Passes’ method also known as risk prioritization.
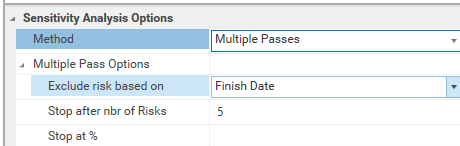
The method for running can be selected in the Sensitivity Analysis Options, in here you can also select the number of top risks you wish to calculate and whether a top risk should be determined by its impact on the schedule or on the cost.
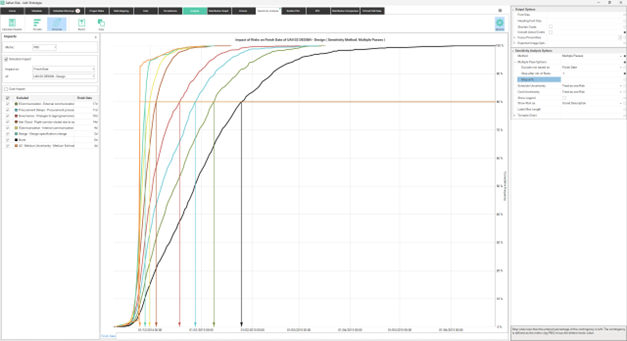
In multiple passes mode the single pass mechanism described above is repeated in its entirety and, after each single pass run has completed, the top risk from that run is removed and the process is repeated until the number of top risks specified in the ‘Number of top risks to calculate’ option are found. Alternatively you can also specify that the analysis should stop when less than a specified percentage of contingency is left.
The following screenshot shows the results from a multiple pass run to find the top seven risks, you can see that each curve is moving further and further to the left, this is because at the end of each full single pass run the top risk is removed and not put back in for the next single pass run. As a result, if you were to run this method for all the risks in the project, the curves would draw all the way back to a straight line.
Using the multiple pass approach can help to reduce the situations where larger risks are masking the impacts of smaller risks. Note that if you want to change a setting like the percentile or impacted activity, after you’ve ran an analysis, the analysis needs to be re-run. This is because these settings can affect the order in which the risks are excluded.
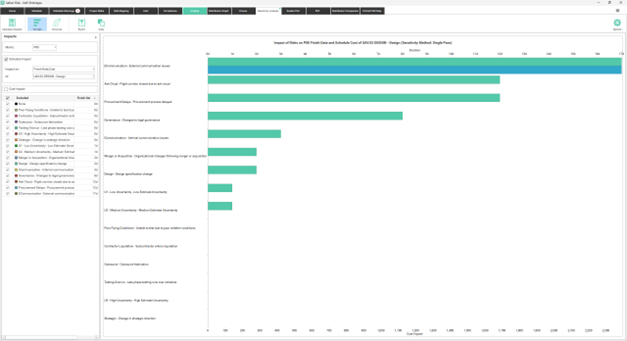
Tornado View
In addition to s-curves the results of the sensitivity analysis can be presented as a tornado.
To do this you click the Tornado icon in the toolbar. The tornado shows both the schedule and the cost impact as default. To change the tornado settings you click Options | Tornado Chart Options.
Sensitivity Options
There’s a number of options that will affect the results of the sensitivity analysis.
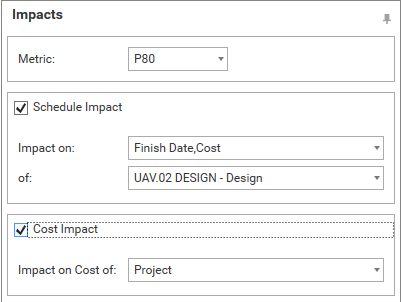
Impacts Pane Options
The sensitivity is all about seeing the impact of the risks. In the impacts pane you choose which impact. It could for example be the impact on the finish date of the project or on the duration of a summary.
Changing the options in the impacts pane will have an immediate effect on the charts and impacts table. If the analysis needs to be re-run in order to produce the results you will get a message offering you to the possibility to cancel.
| Option | Description |
|---|---|
| Metric | This is the metric that is used to calculate the impact. The impact is the difference of the metric when the risk is included and excluded. |
| Schedule Impact | Here you choose which schedule data to see the impact on. It is possible to select a combination of data types. |
| Cost Impact | Here you select which cost data to see the impact on |
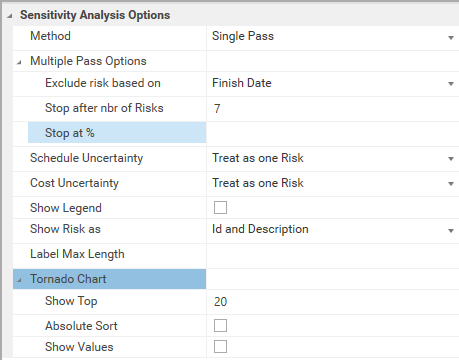
Sensitivity Analysis Options
If you click on the options icon in the ribbon you will see more options. These options are related to the method used to calculate the impacts, and to how the results are displayed.
| Option | Description |
|---|---|
| Method | Single or Multiple passes. These two methods are described earlier in this chapter. |
| Multiple Pass Options (only used if the method is Multiple Passes) | |
| Exclude risk based on | Specify whether risk should be excluded form the next run based on its impact on schedule finish date, duration, start date, schedule cost or cost impact. This setting will also affect the Stop at % setting in terms of calculating the contingency! |
| Stop after nbr of Risks. | Stop when impacts have been calculated for the entered number of risks. |
| Stop at % | Stop when less than the entered percentage of the contingency is left. The contingency is defined as the metric (eg P80) minus the deterministic value. |
| Schedule Uncertainty | Determines how the schedule uncertainty (uncertainty entered in the schedule tab) should be treated during the sensitivity analysis. Either all uncertainty can be excluded in one go (treat as one risk) or the uncertainty for each activity can be excluded one at a time (treat as individual risks). |
| Cost Uncertainty | Determines how the cost uncertainty (uncertainty entered in the cost tab) should be treated during the sensitivity analysis. Either all uncertainty can be excluded in one go (treat as one risk) or the uncertainty for each activity can be excluded one at a time (treat as individual risks). |
| Show Legend | Show Legend in the S-Curves chart |
| Show Risks As | Determines how the risks are displayed in the Sensitivity Analysis Results. This affects both the impacts table and the tornado chart. |
| Label Max Length | Set this to limit the number of characters in a label. |
| Tornado Chart | |
| Show Top | Specify the number of risk drivers you are interested in. |
| Absolute Sort | Choose whether to sort on absolute values. |
| Show Values | Select if you want to see the values in the tornado graph. |