Probabilistic Cash Flow
If you want to investigate how risks and uncertainty in your model affects your cash flow, the Probabilistic Cash Flow (PCF) is the report for you.
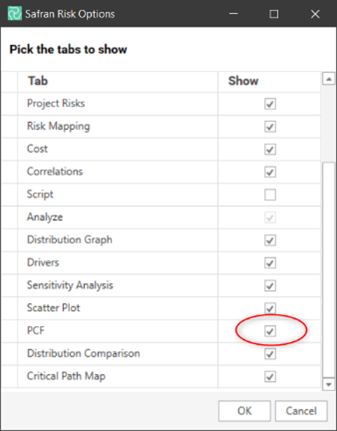
T
he report is hidden by default. To see it, open the Options dialog and make sure it is selected in the “Show” column.
The source of the cost data
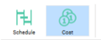
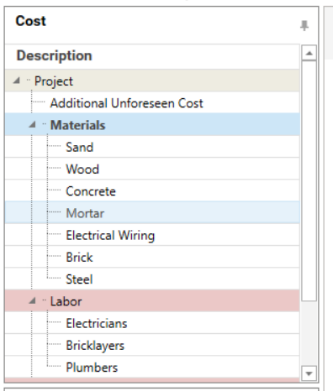
In Safran Risk costs can be modeled as either resources in the Schedule or as cost elements in the Cost tab. Whichever method you are using you can create a PCF report. If both types of data is available you will see two toggle buttons in the top right corner. Select the one that you want to use.
The PCF report
As long as the PCF tab is visible, the PCF report will always be produced after a risk analysis is run. Each iteration all the costs and dates necessary to create a cash are gathered. After the analysis all of the cash flows are combined to create the PCF report.
There’s a number of ways you can modify the report.
In the top right corner you can choose to include costs from the whole project or just a sub section of it.
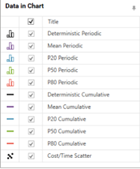
In the bottom right corner you can select which results that should be visible in the chart.
At the top of the chart you have two settings.
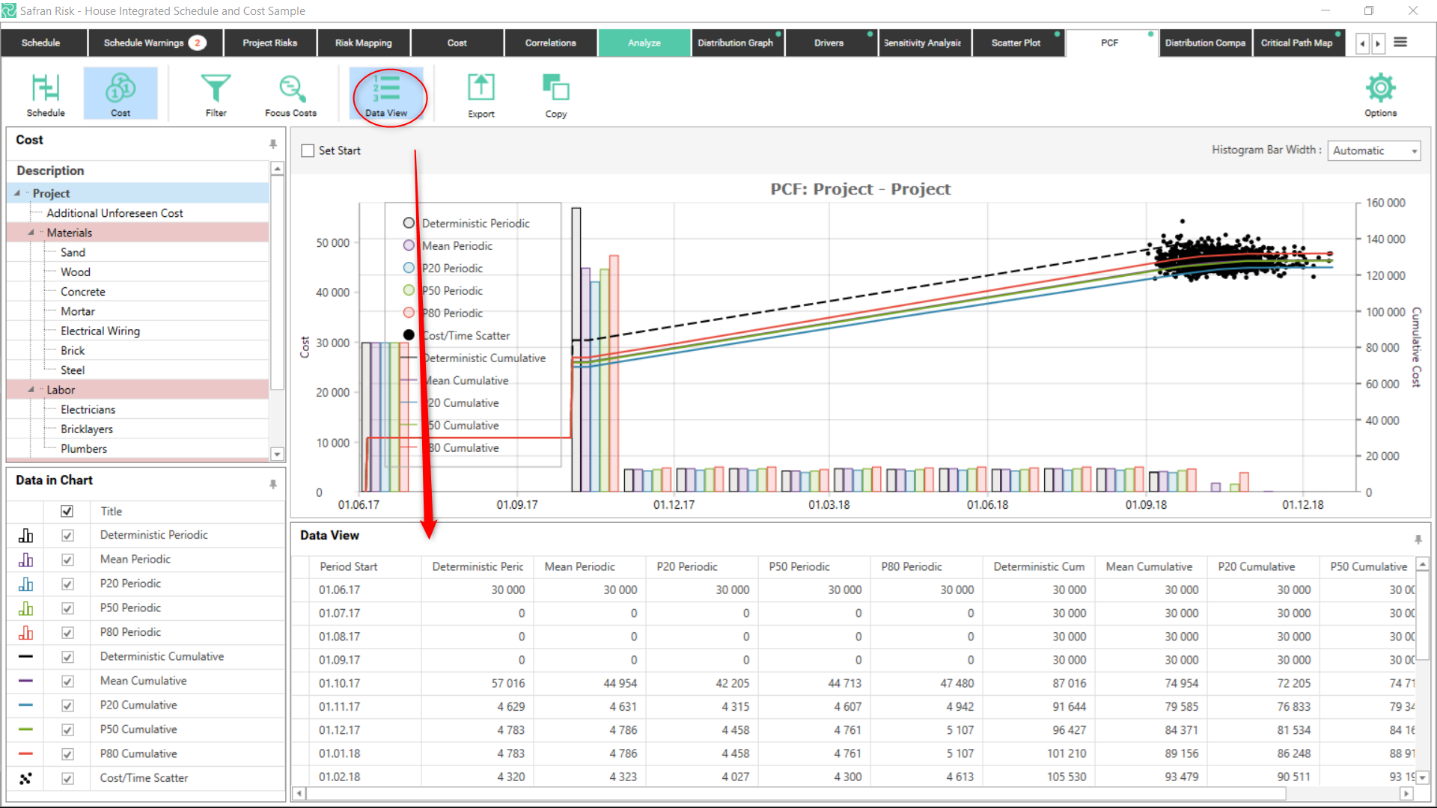
“Set Start” allows you to set a start date data collection. E.g. if you are only interested in costs incurred after 2021, you set this to 1 January 2022.
The “Histogram Bar Width” lets you select the period that you’re interested in.
The Chart
Results will be displayed for Deterministic, Mean and Percentiles. The percentiles are based on the selected focus percentiles. For each data set you can see both the periodic and the cumulative cashflow. Note that periodic cash flow for percentiles will not add up to the cumulative cash flow.
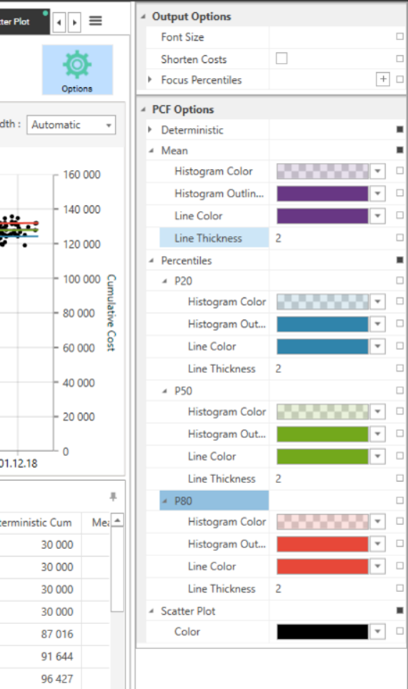
The colors of any of the curves or histograms can be changed in the Options:
The data view
To see the data displayed in the chart as numbers you can click the “Data View” icon.
This data can also be exported to excel by clicking the export icon.