Schedule Risk Analysis
The critical path method (CPM) is a crucial tool for project management, offering estimates of project and milestone completion dates. The overall project duration is determined by the critical path—the longest path through the project. The project represents the project execution strategy to get it done. Activities are linked with relationships to model how the work is planned.
CPM is a key building block of a quantified risk assessment. In a schedule risk analysis, the single-point duration estimates are modeled with a range of possible durations and a profile of how these durations are likely to be distributed. The model is analyzed using Monte Carlo simulation, where you may analyze the project 500, 1000, or 10000 times. When the input is a range, the output is also a range of possible durations and finish dates.
Monte Carlo simulation is a technique for performing risk analysis by running trial runs repeatedly, each time using a different set of random values from the probability distribution. Depending on the number of uncertainties, the Monte Carlo simulation runs thousands of recalculations to produce a distribution of the possible outcome values.
The Benefits of Schedule Risk Analysis
The purpose of schedule Risk Analysis is to consider the inherent uncertainty of the durations of individual activities within a project when assessing the time scale of a project or estimating schedule contingency for your project. Schedule Risk analysis enables users to quickly evaluate factors such as the spread of end dates or the probability of achieving targets.
SRA can be used in any project where the exact duration of some or all activities is unknown. Still, it is possible to say that the duration of the activity is likely to fall between some limits (minimum and maximum), and the duration follows a specific pattern (distribution). Running an SRA, you can discover the effect of the individual variable on the whole project using the standard schedule analysis, considering the variability of particular activities.
Simulation
Schedule Risk Analysis involves running many time analyses on your project using a different set of durations for the activities each time. When every activity in a project can vary in duration, the number of combinations of durations forming the project can be huge, and each will have a different probability of occurring. Time analyzing each combination individually would be an enormous task. Schedule Risk Analysis uses Monte Carlo simulation. Monte Carlo simulation is a statistical way of generating durations representing many combinations.
Remember that the Monte Carlo simulation results may seem a little strange compared to the deterministic duration. For example, if you have four parallel tasks, each of 100 days, with an uncertainty of +/- 50 %, the deterministic duration for finishing them seems to be 100 days.
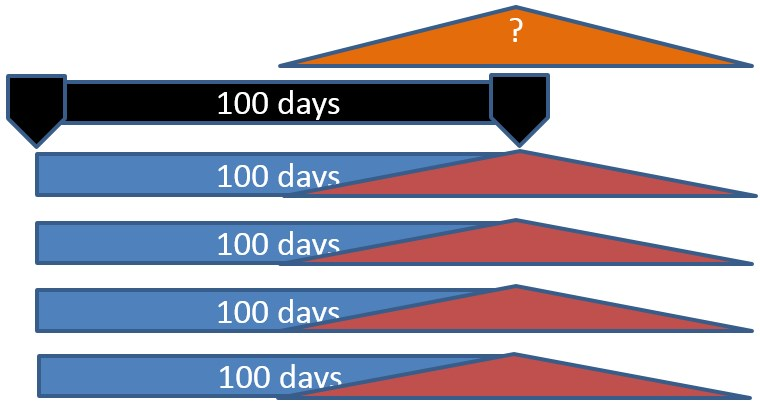
However, after running the Monte Carlo simulation, the answer will be:
- 50% x 50% x 50% x 50% = 6.25%
The durations are generated using input parameters like three-point estimates and distribution profiles specified for each activity. A model of the project is built up by performing a large number of time analyses, which statistically represent the variation of the original parameters.
This model can then provide information on the likelihood of finishing the project or on individual critical activities and milestones. The calculation process follows three steps:
- Each activity is examined, and a duration is generated for it.
- A standard Safran Time/project analysis is performed.
- These steps form an iteration and are repeated as many times as specified by the user. At the end of each iteration, the data is stored so that when all iterations are complete, Safran can calculate possible start and finish dates, their likelihood, and the criticality index of each activity.
The results of each iteration are not statistically interesting in themselves. It is the sum of a large number of iterations that allows us to evaluate the probability of, for example, finishing on time. The confidence that can be placed in the result depends on the accuracy of the CPM model or the accuracy of the user-specified distributions.
Distributions
To perform SRA time analysis on a project, you must provide some information on the expected variability in each activity. Safran can have four distributions: Square, Triangular, Trigen (10/90), and Gauss.
Using SRA in Safran
The Schedule Risk functionality is fully integrated with and within the Barchart Editor. It is easy to use, and the extra required knowledge can be learned by attending a training class or studying a textbook on the subject.
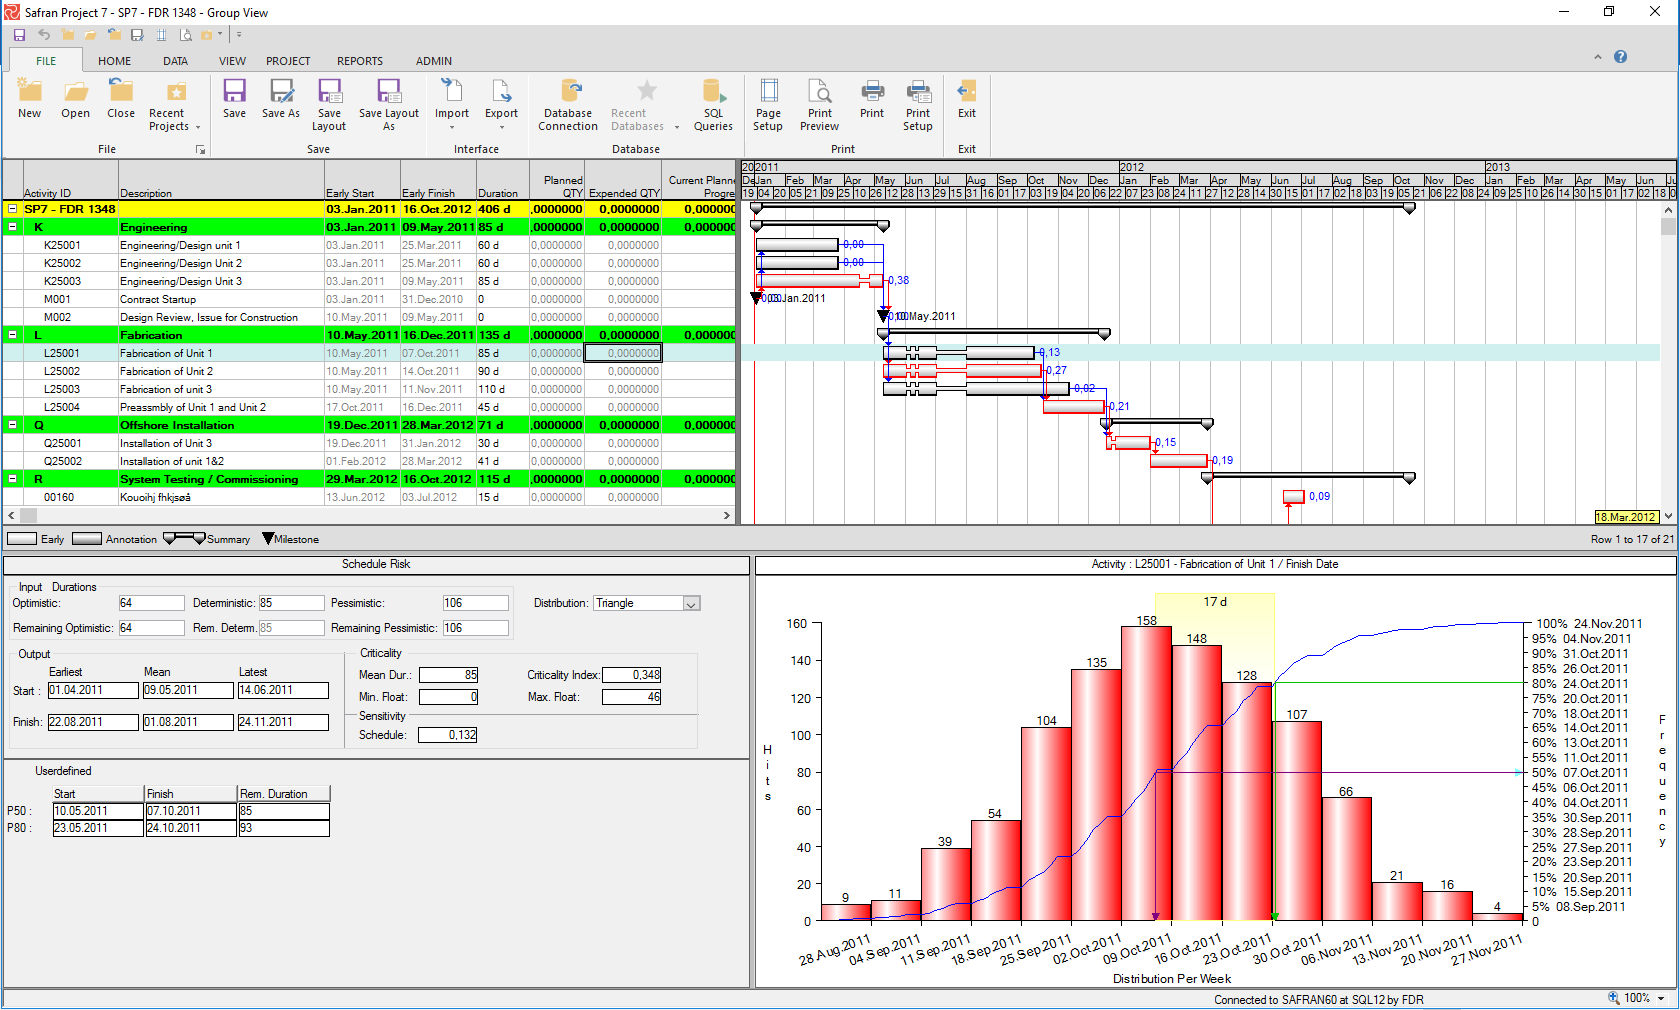
The Schedule Risk pane is divided into two parts. At the right is the output area after the analysis. The left is both an input panel to enter three-point activity durations and a distribution profile, and it displays the Schedule Risk Analysis output. Both sub-panes have a short-cut menu to access Schedule Risk functions, chart selection, and setup functions. The risk functions for the left pane can also be accessed from the process menu.
The risk input and output data can be included as columns in the activity columns area. You can also use risk start and finish dates to add bars to your barchart.
Three-Point Estimates
Before any risk simulation, you must collect data representing duration uncertainty. It would be best to have a best-case scenario (minimum), a worst-case scenario (maximum), a most likely scenario, and a specific probability distribution—the best-case scenario results from all contributory factors to the duration behaving as expected. The worst-case scenario results from several or all factors affecting the duration going wrong, pushing risk and uncertainty to the extreme.
The most likely duration is viewed as more likely than any other duration in the possible range, spanning from the best-case to the worst-case duration. It is essential to note the most likely duration may not be identical to the duration entered into the schedule. A wide span between the shortest and the most prolonged duration indicates an activity with higher uncertainty. A narrower span means lower uncertainty and, therefore, higher confidence.
Entering Three-Point Estimates
You can enter the three-point estimates and the distribution profile either in the columns area or using the left part of the risk view of the Barchart Editor. The three-point durations can also be set using Assign fields.
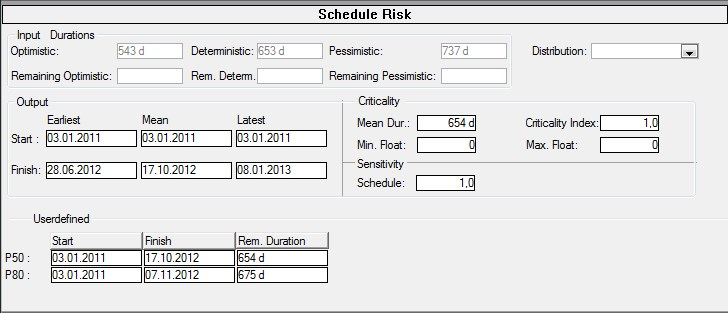
At the top of the risk pane, you can input the optimistic (minimum) duration, the most likely (deterministic) value, and the pessimistic (maximum) duration that the activity can take. These columns can also be inserted into the column area of the barchart. All risk fields start with ‘Risk,’ such as Risk Optimistic Duration, Risk Critical Index, etc.
You should also note that you could add three-point estimates for the remaining durations relating to activities and projects in progress. The most likely or deterministic value can be set equal to the activity duration or separated from this value. See the setup section.
Quick Risk
Safran Project includes Quick Risk, a feature that allows you to set optimistic and pessimistic durations as percentages of the activity duration and set the probability distribution. Quick Risk can be used to set values for a selected range of activities and all activities, or users can apply a filter. If your most likely duration value is separate from the activity duration, this can also be set as a percentage of the activity duration.
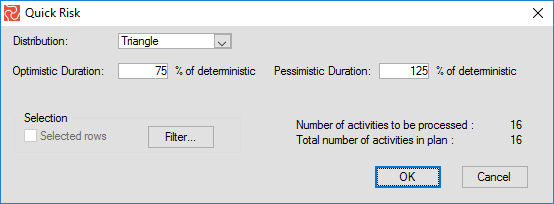
Quick Risk contains a filter option that allows you to select activities by selecting the activities in the barchart and then selecting the Quick Risk function. Please note that a complete Schedule Risk analysis follows directly after pressing the OK button.
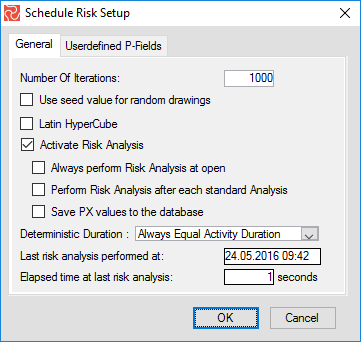
Risk Setup
Safran Project provides a simple schedule risk analysis setup through a tab-separated window. The main tab lets you define a basic analysis setup.
| Field | Description |
|---|---|
| Number of iterations | To specify how many iterations of a particular Monte Carlo simulation are needed. |
| Use seed value for random drawing | When is not selected, Safran will run the simulation every time with a randomly selected seed number. When it is not set, the seed value is fixed and is equal to the whole project’s sequence number. |
| Latin Hypercube | When not selected the sampling method is Monte Carlo, and when set the sampling method is Latin Hypercube. |
| Activate of Risk analysis | Gives you two options for when the analysis should run. |
| Deterministic Duration | Most likely, duration settings Always Equal Activity Duration or a Separate Value. |
Seed values are integers used to generate the exact sequence of pseudorandom numbers for Safran Risk simulation modeling. Using seed values is beneficial for developing risk models as you can change your risk model and see how your results are affected by the changes alone, not the effects of randomization.
Latin Hypercube: Unlike the Monte Carlo method (MC), which is based on random sample generation of N intervals for each uncertain input variable of a model, the Latin Hypercube method (LH) spreads the probability distribution samples more evenly.
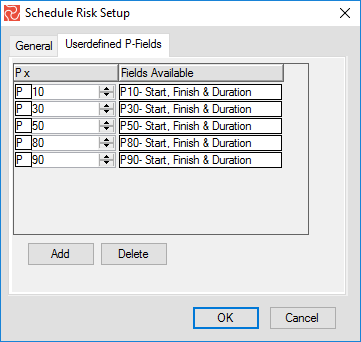
Accessing the user-defined P-Fields tab, you can specify which percentile data you want to save for later reference together with your project schedule. This data will be displayed in the risk pane, and can also be selected in the activity columns area and used to create user-defined symbols.
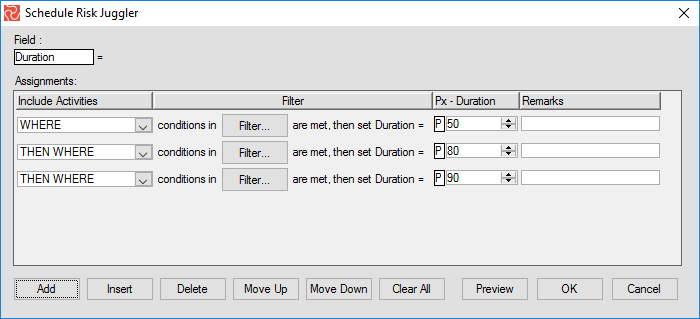
Risk Juggler
The Risk Schedule Juggler allows you to set risk duration into the duration field of the standard analysis field or an alternative analysis set. This will enable you to compare different outputs of the scheduled risk analyses with the standard project analyses. Available duration to set from can be selected from any of the Px-sets you defined on the Schedule Risk setup. You can also put parts of your schedule to use one value and another value for other parts by using the Risk Juggler's conditional features.
Risk Health Check
The Risk Health Check is a function used to check for consistency between minimum, most likely, and maximum durations before running a Schedule Risk Analysis.
Overview of Fields in the Schedule Risk Analysis
| Field/Column | Note |
|---|---|
| Risk Critical Index | % The activity is on the critical path. |
| Risk Distribution | Input: Distribution function: uniform, Triangle, Beta Pert, Trigen(10%,90%). |
| Risk Earliest Finish | Earliest finish date from the simulation. |
| Risk Earliest Start | Earliest Start date from the simulation. |
| Risk Latest Finish | The latest finish date from the simulation. |
| Risk Latest Start | Lates start date from the simulation. |
| Risk Maximum Duration | Input: max duration for the 3-point estimates. |
| Risk Maximum Total Float | Maximum total float calculated during simulation. |
| Risk Mean Duration | Mean Duration calculated during simulation. |
| Risk Mean Finish | Mean Finish calculated during simulation. |
| Risk Mean Start | Mean start calculated during simulation. |
| Risk Minimum Duration | Input: min duration for the 3-point estimates. |
| Risk Minimum Total Float | The minimum total float calculated by the simulation. |
| Risk Most Likely Duration | Input: activity most likely duration for the 3-point estimates. |
| Risk Most Likely EF % | % of probability of meeting the deterministic schedule. |
| Risk Px Duration | Saved the user-specified Px duration. |
| Risk Px Finish | Saved the user-specified Px Finish date. |
| Risk Px Start | Saved the user-specific Px Start date. |
| Risk Schedule Sensitivity | Schedule sensitivity Index. |
Note: There can be several Px datasets, such as P10, P20, P50, P80, and P90. The Risk Setup determines the number of Px fields.
Risk Reporting
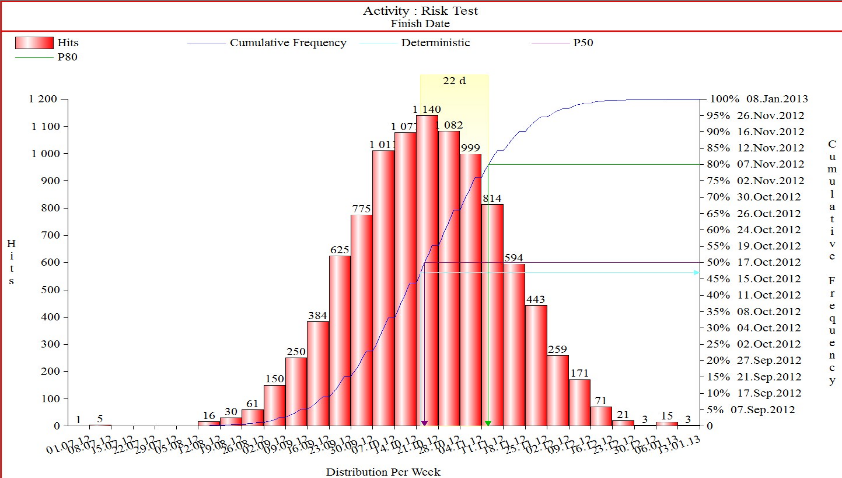
After running the risk analysis, Safran offers different reports to evaluate the analysis output. You will find the typical risk histograms and tornado charts, but you can also include bars showing risk dates in your barchart to compare these with your planned or deterministic plan. The risk histogram can show the spread of start dates, the spread of finish dates, the durations, and the float. The tornado chart can show the criticality index and the schedule sensitivity index.
The criticality index tells you how often an activity is on the critical line out of all iterations.
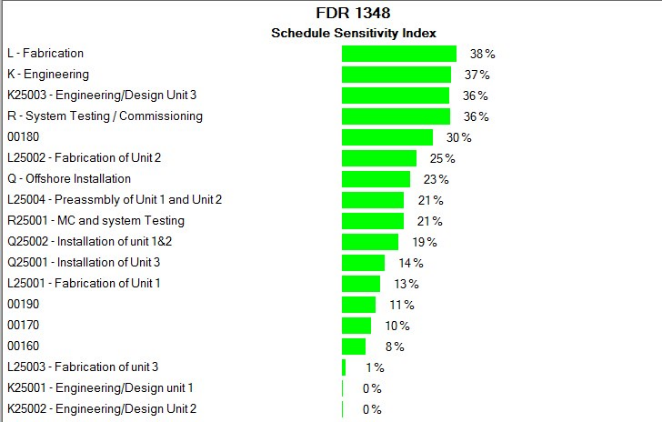
The schedule sensitivity index is a bit more complex and combines the activity standard deviation with the Criticality Index and project standard deviation. You can use the two indexes to rank the order of activities.
Select Chart Type
You select chart type by choosing the Chart option from the short-cut menu in the graph area.
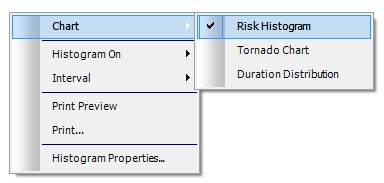
Chart Setup
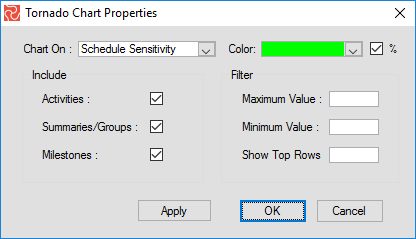
Users can specify the appearance of the Tornado Chart and the Risk Histogram. For the tornado chart, users can select the color of bars, include % values, summaries, activities, and milestones, specify minimum and maximum values to be displayed, and show only some top rows. In addition, you can choose to show the Criticality Index or Schedule Sensitivity Index.
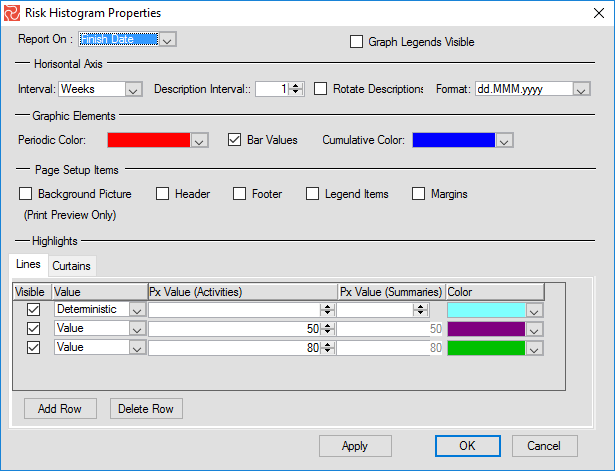
The risk histogram properties allow users to specify a range of values, percentile line markers, curtains spanning selected percentile values, and more, adding flexibility to displaying the results after the scheduled risk analysis. You will probably add line markers that are part of the PX values you defined as part of your setup. However, note that you can specify any line marker for the histogram independent of the Px setup values.
You can also define a line marker that reads the value from a user-defined field. This allows you to view one percentile value for some activities and different percentile values for others.
Please note that the histogram shows the editor, values, and histogram for the highlighted activity in the Barchart Editor. As you move up and down, the histogram will change accordingly. If you have grouped your schedule to show summaries, the histogram and values for the summary will be displayed. You can also change the group values and reorganize the schedule, and Safran will recalculate summary values.
Please note that Safran does not store the details of iteration data, which are lost when you close the editor. You must re-run the Schedule Risk analysis to view the risk histogram and Schedule Sensitivity Index. However, the output data shown at the left part of the risk pane are stored and can be viewed at any time.
Print and Print Preview
The risk histograms and tornado charts can be printed, saved as PDF files, or emailed to project stakeholders and colleagues. Graphics can also be copied to the clipboard for use in project reports. You can use the Histogram Properties window to tell Safran to use report headers, footers, etc., from the Barchart Editor page setup.
Tornado charts are another type of barchart in which the data is listed in a hierarchical vertical order. Usually, the most significant value appears at the top of the chart, then the second value, and so on, and the results appear in a chart that looks like one-half or a complete tornado.
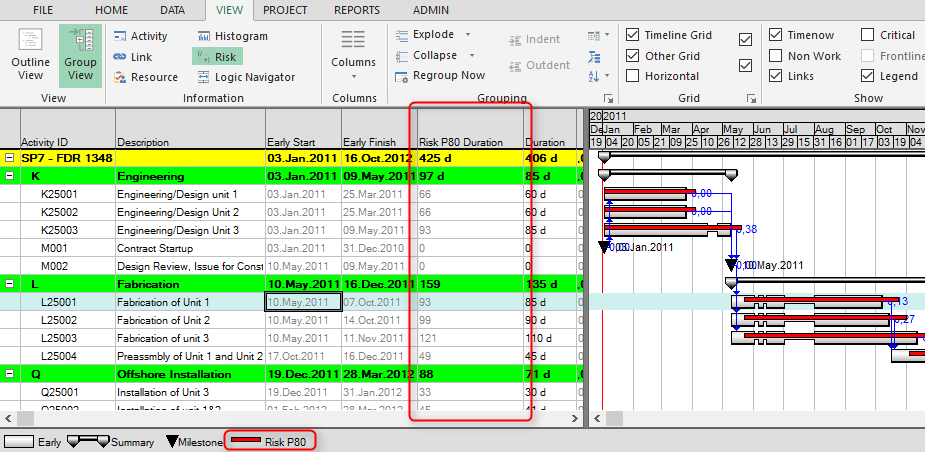
Showing Risk Dates in the Barchart
Using the standard layout and symbol definitions, Safran Project users can create powerful custom views to compare the deterministic durations with any duration span from the schedule risk analysis. Note that the dates you can report in the Barchart Editor are the ones you entered via the user-defined P-fields tab on the risk setup window.