The Six-Period Summary Report
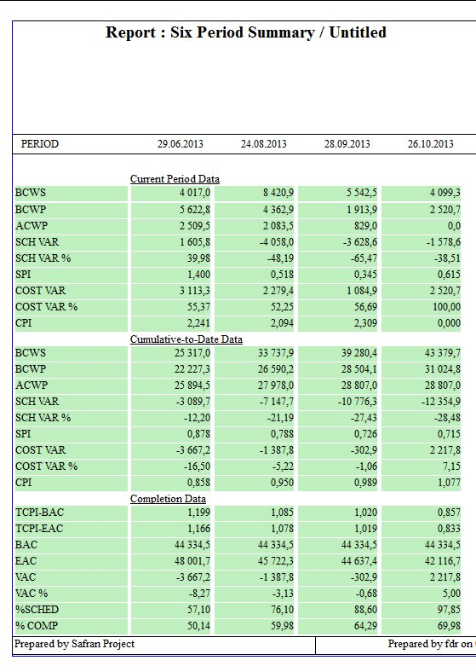
The Six Period Summary Report is a configurable tabular status report that shows all the major earned value indicators sectioned and grouped by current period values, cumulative values, at-completion values, and statistical and independent forecasts.
The Report can be configured to summarize and group information by standard codes and values, like, for example, discipline, project phase, WBS, OBS, Sub-phases, and more, provided this information is included in your schedule data. The six-period summary report and the progress summary report may show related data.
The Progress summary report will give you data and information related to the last, or a selected single, cut-off. The six-period summary report lets you compare six columns of data and information, allowing you to compare Project summary data for six periods—hence its name.

Configuring the Six-Period Summary Report
The six-period summary configuration window provides a standard report configuration window with five tabs: Titles, Filter, Report, Fields, and Resources. The Title and Filter tabs are described in the section covering standard report features, “Preparing, Viewing and Printing Reports and Graphics.” The Resources tab is identical to the resources tab feature in several other Safran report configuration panes. It allows you to make selections of the resources to be included in the report.

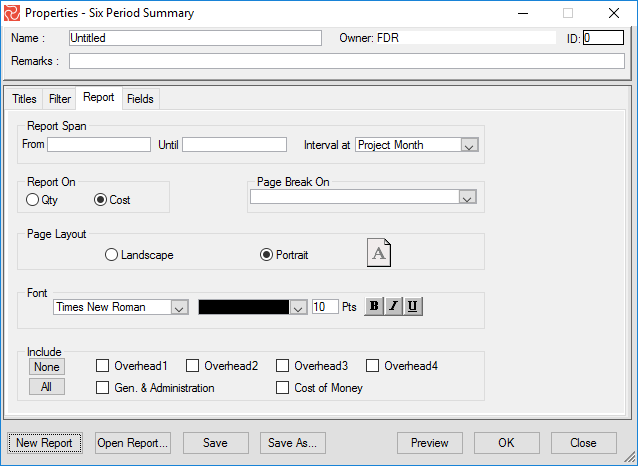
Using the Report and Field tabs, you can customize the report span and report intervals and group the report by selecting a code for page breaks. If you report on cost, you can specify cost elements to be included, provided you are using complex rates. Follow these steps to configure your six-period summary report:
- Select reporting and interval. Intervals can be each cut-off, Project Month, or Bi-Weeks. The default interval is Project Month.
- Select to report on Cost or QTY/Work. The default is Cost.
- Select Page Break to produce a report grouped by common values with one page each.
- Specify orientation. The portrait orientation displays up to 6 periods. The landscape orientation shows up to 9 periods but will produce a 2-page report if you include all available fields. If you select landscape, de-selecting some fields can reduce the number of pages. The default is landscape (6 periods).
- Select a font style for the body of the report.
- Select Cost indirects to be included. This feature is only available if you have set up your project to use Complex Rates.
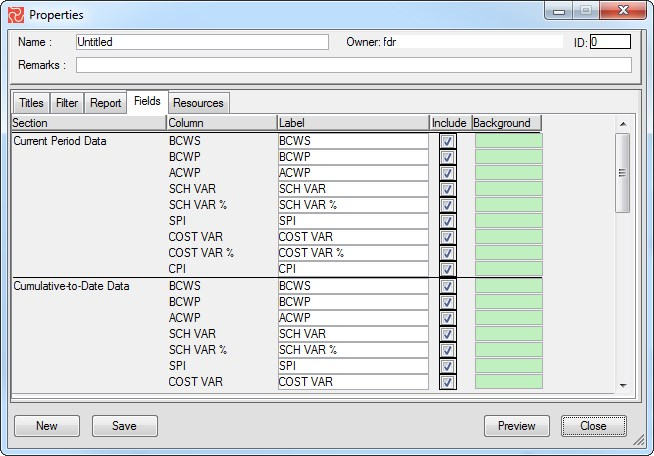
Using the Fields tab, you can select the columns to be presented for the four different sections or blocks of information, type in your labels, and select a background color for each field.
