Reports and Graphics - Preparing, Viewing and Printing
This chapter lists the different report types available in Safran Project. As an introduction, features that are common to the report types listed under the report menu options are briefly discussed in this chapter. Specific details about each format are discussed in the sections for each report type. This chapter should be studied with the sections concerning the different report formats and available report types.
One of the primary purposes of a project control system is to provide relevant, precise, and timely information. To do this, a wide range of reports and charts must be available so that the best and most appropriate display can be used to pinpoint and highlight any particular piece of information. Additionally, it should be easy to switch between different display styles and layouts and be under complete user control, not predefined and rigid.
To make the right decisions to lead and manage businesses or projects better, managers at all levels need timely information and accessible information in a convenient form. Timely, reliable information geared towards keeping everyone informed mitigates risk. Without data, managers or project team members do not know how well or how bad they are doing.
Many organizations have a rich history of making good, detailed schedules but not a rich history of sharing those throughout the organization.
Having the correct information available, accessible in a convenient form, and on a timely basis has been the desire of managers at all levels.
Why at the appropriate level? Executive managers need a consolidated view of their project’s performance and generally do not want to be confronted with many details. In contrast, line managers must drill down to the source of problems, such as cost and schedule overrun.
Why is it accessible in a convenient form? Because data is of no use if presented in an obscure form or the information is hidden behind the numbers. All you want is to have your megabytes or exabytes of data transformed into insightful and shareable information. Please show me the info!
Why timely? Because 'out of date' is another way of saying inaccurate. Decisions made today based on weeks-old information could be perfectly justifiable in the light of available information but wrong.
The whole purpose of producing reports and charts is to provide relevant, reliable, predictive, and accurate information. It follows that a wide range of reports and graphs must be available.
The report types are listed in the REPORTS ribbon:
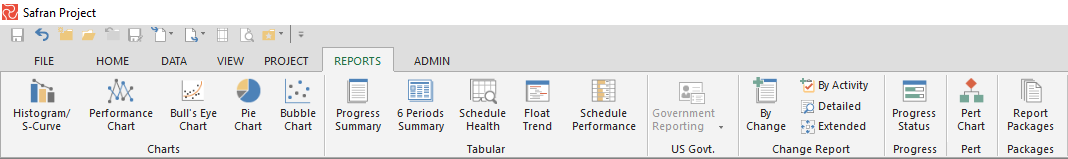
Safran Project provides a focused set of flexible and user-definable specifications for management graphics and reports. The Government Reporting capabilities, the Contract Performance Report format 1-5, the OMB 300 report format, the NASA 533M format, and the X12, UNCEFACT XML Transfer files are discussed in the ‘Government Reporting’ section. In addition to these standardized, governmental, fixed format reports, Safran Project lets you configure, run, view, print, and save a library of report configurations for the following report types:
| Report | Description |
|---|---|
| Histogram/S-Curve | An axis-based graph for periodic, cumulative presentation, including a table graph. |
| Performance Chart | An axis-based graph allows you to draw performance index graphs. |
| Pert Chart | Graphic Pert diagram showing project logic. |
| Pie Chart | Graphical report enables you to show the proportional size of items that comprise a data series to the sum of items. |
| Bull’s-eye Chart | Plots the cut-off periods on a CPI – SPI matrix to show trending if an element is ahead/behind schedule and over/under budget. You can set a company or user-defined threshold band to highlight if elements are within range. |
| Change Reports | Tabular report showing change order information. |
| Progress Summary | Tabular report providing data for performance measurement. |
| Six Period Summary | Shows all the major earned value indicators for the current period, cumulative, at complete, and statistical forecasts with 6 or 9 periods. |
| Report Packages | It allows the definition/execution of stored reports to be run in batch. |
| Schedule Health | Summarizes activity, logic, milestones, float, performance indices, and more that can be used to assess how good your schedule is. |
| Float Trend Report | Shows activities grouped by float band values. It can display data grouped and also by last Cut-Off or all Cut-Offs. |
| Progress Status Report | Organizes activities according to start or finish dates and uses color coding to show progress status. |
| Schedule Performance Report | A summary report showing planned %, periodic, and cumulative for various scopes. |
| Bubble Chart | Available for Project Groups/Portfolios. Plots progress performance in an axis diagram similar to the Bull’s-eye report. The third dimension, the size of the bubble, represents the Baseline scope. |
| Screen Reports | On-screen listing of the Baseline and Status Update logs. |
In addition to the standard reports listed above, the Barchart Editor Gantt view and the Barchart Editor Histogram view are widely used for reporting purposes due to their extensive formatting and grouping capabilities.
Please see The Barchart Editor chapter for details.
Common Report Features
Safran reports share a standard look and feel and common features. When selecting a report type, Safran provides a tab-separated user interface with identical title and filter tabs across all report types.
Standard reporting features include the ability to save a set of different configurations to build libraries of reports; select report specifications from a drop-down list; a preview feature including Save As; print options and mail options; the ability to transfer report specifications to and from other Safran databases; and the ability to view report specifications created by yourself (user), all users or specified to be included in report groups.
You will move between the different tabs to specify and configure your report as a user. Safran allows you to switch between the configuration and print preview modes. From the print preview, you can save the report (the output), direct it to a printer, save it to PDF or graphical formats or Safran Web Access, or attach your report to an email.
Common for all reports is an extensive and flexible set of configuration panels, giving you complete control over the report's layout and content. These panels provide full control over selection, sorting, fields, graphic elements, content, headings, etc.
The reports may be run "as is" based on "sensible defaults” for each report. This lets you view a report immediately without any previous experience with Safran Project. Custom reports can be made by modifying a standard report configuration and saving it under a new report name. Using this feature, Safran Project allows you to build a library of reports containing summary, grouping, selection, data, and content specifications.
Reports may be viewed or printed one-by-one, or report packages containing multiple reports may be generated, making producing monthly reports extremely efficient.
Choosing a Report Specification
In the REPORTS tab, choose a report type from the ribbon. Safran Project then presents you with the standard report configuration panel, enabling you to select from the list of existing report specifications. The available report specifications to select may be controlled by selecting various options from the Choose Reports From drop-down list. This list will present report groups, which you have been granted access to by your system manager, your own saved report specifications (User Reports), and the ability to include all report specifications created and saved by other users.
Creating a New Report Specification
You can modify existing specifications and give them a new name or start from ‘scratch,’ configuring all elements by clicking the New button in the configuration window.
The tabs presented by Safran Project may then be used as a guide through the report configuration process. Each tab contains a set of configuration options that will be discussed in detail in the following chapters. The tab header hints at what type of configuration option is on the tab. All reports utilize the same standard tabs.
After completing the configuration process, click the Save icon in the ribbon or press the Save button in the dialog window to save the new report specification. You can open an existing report, modify the configuration, and save it as a new report. When you click the Save As icon, Safran Project will prompt you to enter a new report name.
Adding Remarks
You can add remarks by choosing Remarks in the report Properties window. To save any remarks, press the Save button in the properties window. Remarks may be added to any report specification, including reports created by other users.
Adding remarks to your report specification is a good option and helps you select from reports with similar report names. If your company also uses Safran Web Access, available reports are listed with names and remarks.
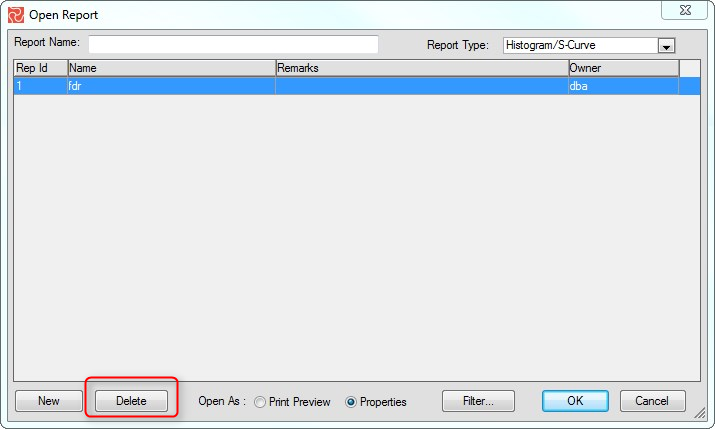
Deleting a Report Specification
When you open a report, select the report name that you want to delete and then press the Delete button. You will not be allowed to delete reports created by other users.
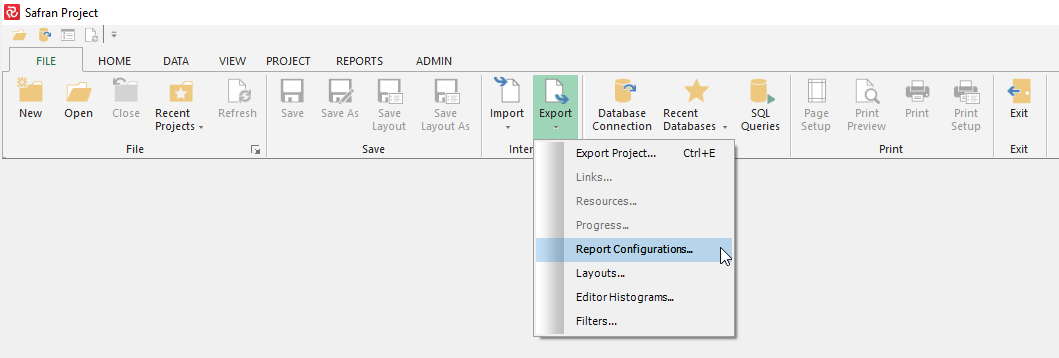
Exporting Report Configurations
Your report configurations may be exported for use by other users. Choose File>Export>Report Configuration.
Importing Report Configurations
You may import report configurations from the file by choosing File>Import>Report Configurations.
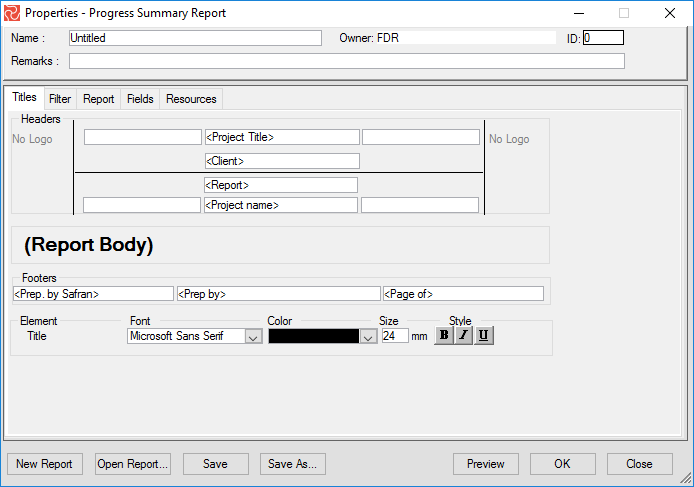
Specifying Titles, Headers, and Footers
Once you have selected the appropriate report type, you can choose or type in report titles, subtitles, header, and footer information. You can also specify text attributes such as font, font size, font style, and color. The header area includes four lines. You can also include the company and customer or project logo in your header. The elements configured will be printed on each page of the report. The field values in the Titles tab may be entered directly and contain fields or plain text. Alternatively, system globals may also be selected from the drop-down list. The fields in the Titles tab are organized in WYSIWYG fashion, i.e., relative to the position they will appear in the report.
| Specifications | Description |
|---|---|
| Header | The header is placed on top of every page. You may define report-specific report logos, use the project definition, or choose no logo as part of the header. |
| Footer | Footer appears at the bottom of every page. |
| Report Body/ Project | By default, the current Project is the source of all reporting data. You may, however, select another project from a drop-down list. |
By default, the following values for header and footer information are:
| System Global | Description |
|---|---|
| Analyzed | Date of last Time Analysis for the selected project. |
| Client | The Client name is defined under Setup Project. |
| Contractor | Project contractor. |
| Cut-Off | The latest Cut-Off date for the selected project. |
| Project Name | The selected project's 'Project Name' field, as defined in Setup Project. |
| Page of | Number of pages tag. |
| Prep. By | Prepared By; the user log-on ID. |
| Prep. by Safran | Prints “prepared by Safran” on your report. |
| Project text1-4 | Information entered in the text1-4 fields in the Setup Project window. |
| Project Title | The Project Title is defined under Setup Project. |
| Report | Report Name. |
| Selection | Prints selection filter expression. |
| Status pr. | Date of last Status Update for the selected project. |
| Timenow | Timenow date for the selected project. |
| Today | The date is a reference to when the report was produced. |
| Enterprise codes | All defined Enterprise codes may be included. They will be listed with their names. |
Selecting Font, Color, and Text Attributes
For each element in the report title and footer, you may select individual text attributes such as font, font size, text color, and style (bold, italic, and underlined). Position your cursor in the element and select text attributes. Notice that as you select different header and footer elements, Safran Project displays its name to the left of the font attributes section.
Including Logos on Your Report
Safran Project supports logos in the report header area. You can include a logo on the right and left sides of the header area. Your logo must be saved as a Bitmap (BMP), JPEG, or PNG file. Choose Change Logo from the shortcut menu to place a report-specific logo on your report. Choose Default Logo to place the project-specific logo defined for the Project (See the Setup Project options) or No Logo to draw a report without logos (Default).
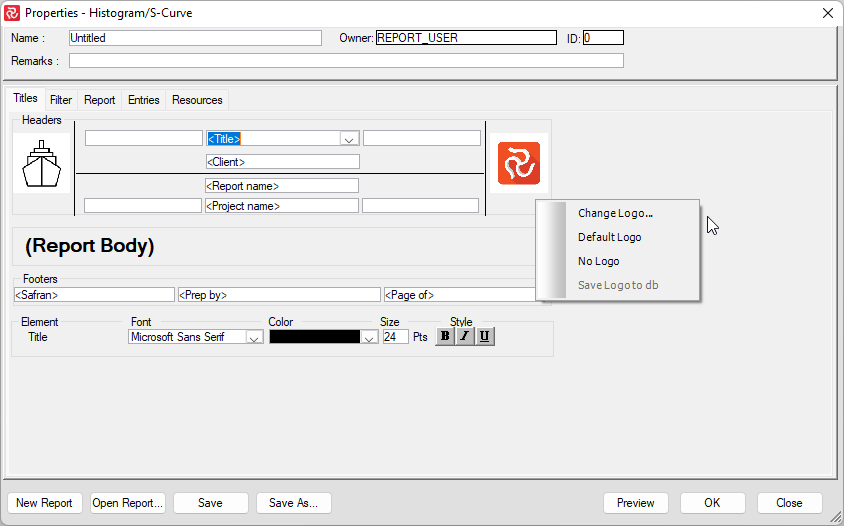
The Save Logo option allows you to save the selected logo to the Safran database and not just refer to it from a selected drive or folder. When committed to the database, other users will benefit from seeing the exact report specification, including the logo. This also applies to Safran Web Access users. If only referred to from a folder, this folder may not be accessible to other users.
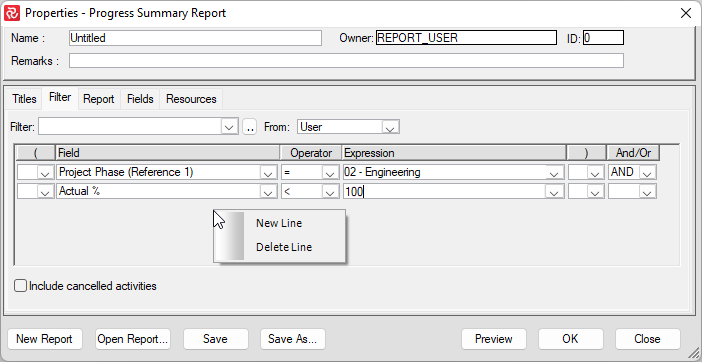
Adding Filters - Selecting Information for Reporting
The next tab in the report configuration pane is the Filter tab. This allows you to limit the data included in your report and focus on a specific area or subset of the project and its related data. The filter tab contains the five fields described below:
| Field | Description |
|---|---|
| Field | Specify the activity-related field to include in the select statement. |
| Operator | Select a valid expression from the drop-down list. |
| Expression | Add a text expression or an activity field name. For certain operators, the expression field is not editable. |
| And/Or | Logical operators to form complex selection statements. The "And" logical operator requires the expressions on both sides to be ‘True.’ The "Or" logical operator may select data where at least one criteria must be fulfilled. |
| Include cancelled activities | A checkbox allowing cancelled activities to be included in the report. |
Select New Line from the short-cut menu to enter a new selection expression. Selecting Delete Line will remove a line from your expression. Using the tab key also adds new lines to this pane. The new line works as “insert above” while adding lines at the end using the tab. You can also select a filter from your previously defined and stored filter list. These will be listed in the Filter drop-down list. As with report names, you can reduce the number of filters in the drop-down by selecting filters from groups, users, or all users or by adding a quick filter by selecting by name, owner, or combination.
Previewing a Report
As you configure your charts and reports, they can be viewed by pressing the Preview button in the window dialog box. This allows you to see the format and layout of a printed report without actually printing it. You can change the configuration of your report continually. To return to the report configuration, click the Properties icon on the ribbon.
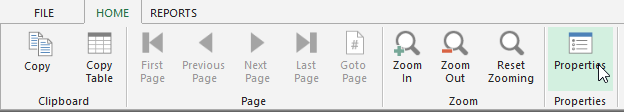
The HOME ribbon contains tools that allow you to navigate page-by-page, jump to another page, zoom, and more.
Printing a Report
After creating and fine-tuning your reports, you may want to communicate project information to others. You can print your report from the print preview window by clicking the Print Icon or selecting the Print option from the short-cut menu.
If you are used to using keyboard short-cut keys, you can alternatively select CTRL+P. This will bring up the printer dialogue box that allows you to direct your output to the right printer. To save time and make weekly and monthly reporting easier, Safran includes a report package feature enabling you to create reports and include reports of different types to run them all in one go. Please see a later subject for details.
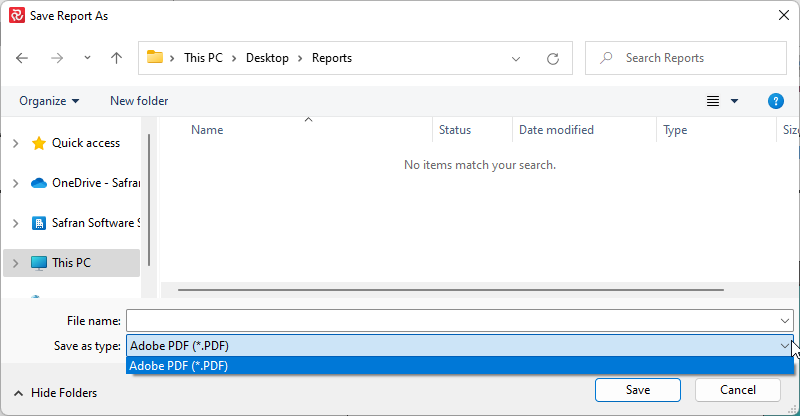
Saving Reports
In addition to the ‘Save’ and ‘Save As’ options, you can use the ‘Save To File’ option to save your reports as PDF files.
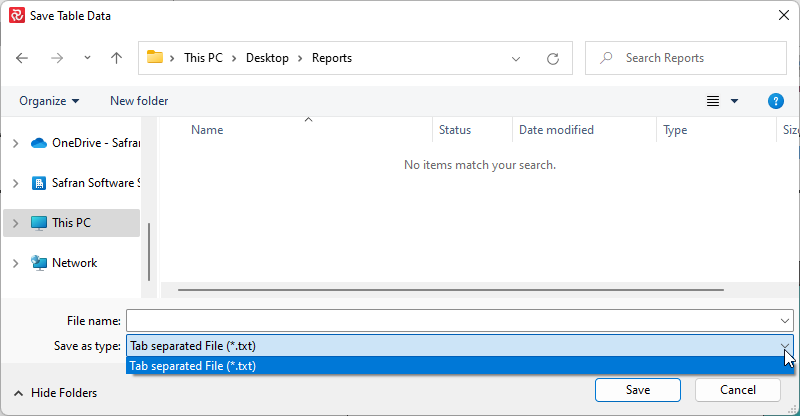
Some reports can also be saved to a txt file, which can then be opened in Notepad or Excel.
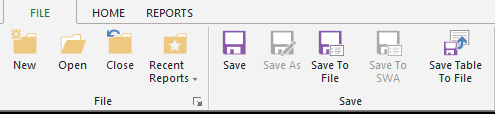


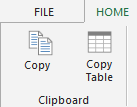
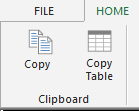
Your reports can be copied to the clipboard by CTRL+C, or by clicking on the Copy icon in the ribbon.
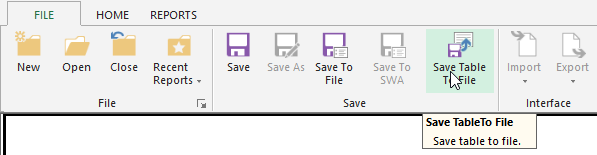
If you have used 'Page on' in your report and want all the table content in one report, you should use the 'Save table to File' function instead of copying the table to the clipboard.
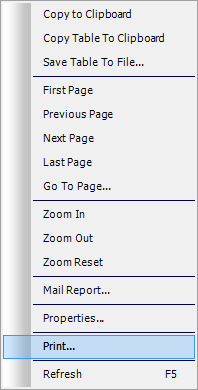
Right-click in the report to get quick access to the various saving options:
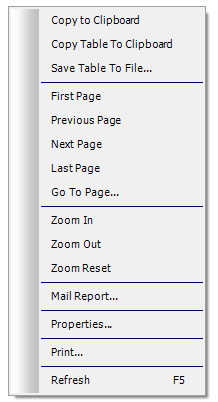
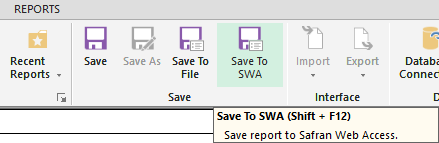
You can also save your reports to Safran Web Access (SWA) and make them available for others to read using their browser.
Copy Report Content
From Print Preview, you can use the copy to clipboard option (CTRL + C) to copy the report and include it in other Windows applications such as Microsoft PowerPoint, Microsoft Excel, or Microsoft Word. Some reports also allow you to copy the data content to XL-type files, for example, copying the table data from the Histogram/S-curve to Excel using the ‘Copy Table’ option.
If you have used 'Page on' in your report and want all the table content in one report, you should use the 'Save table to File' function instead of copying the table to the clipboard:
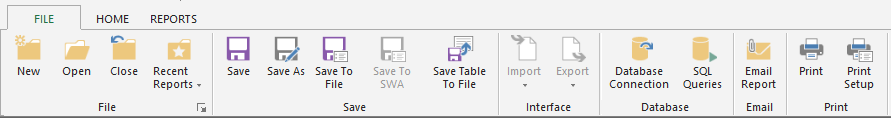
Transferring Customized Report Specifications
If you create a report specification in one Safran Database and you want to use this specification in another database, you can transfer it. Safran contains Import and Export Report Configuration options accessible from the FILE ribbon.
During export and import, you can select which reports to include.
Similarly, Safran Project also lets you export and import Barchart Editor Layouts and Barchart Histogram specifications.